


Test Record Performance Tests
Agilent 81480A and 81680A, 40A, 82A, 42A, & 89A Tunable Laser Modules User’s Guide, Sixth Edition 139
Agilent 81640A Performance Test
Page 13 of 13
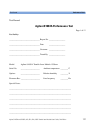
Model Agilent 81640A Tunable Laser Report No. ________ Date_______
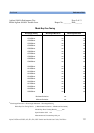
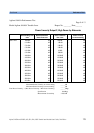
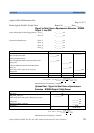
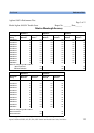
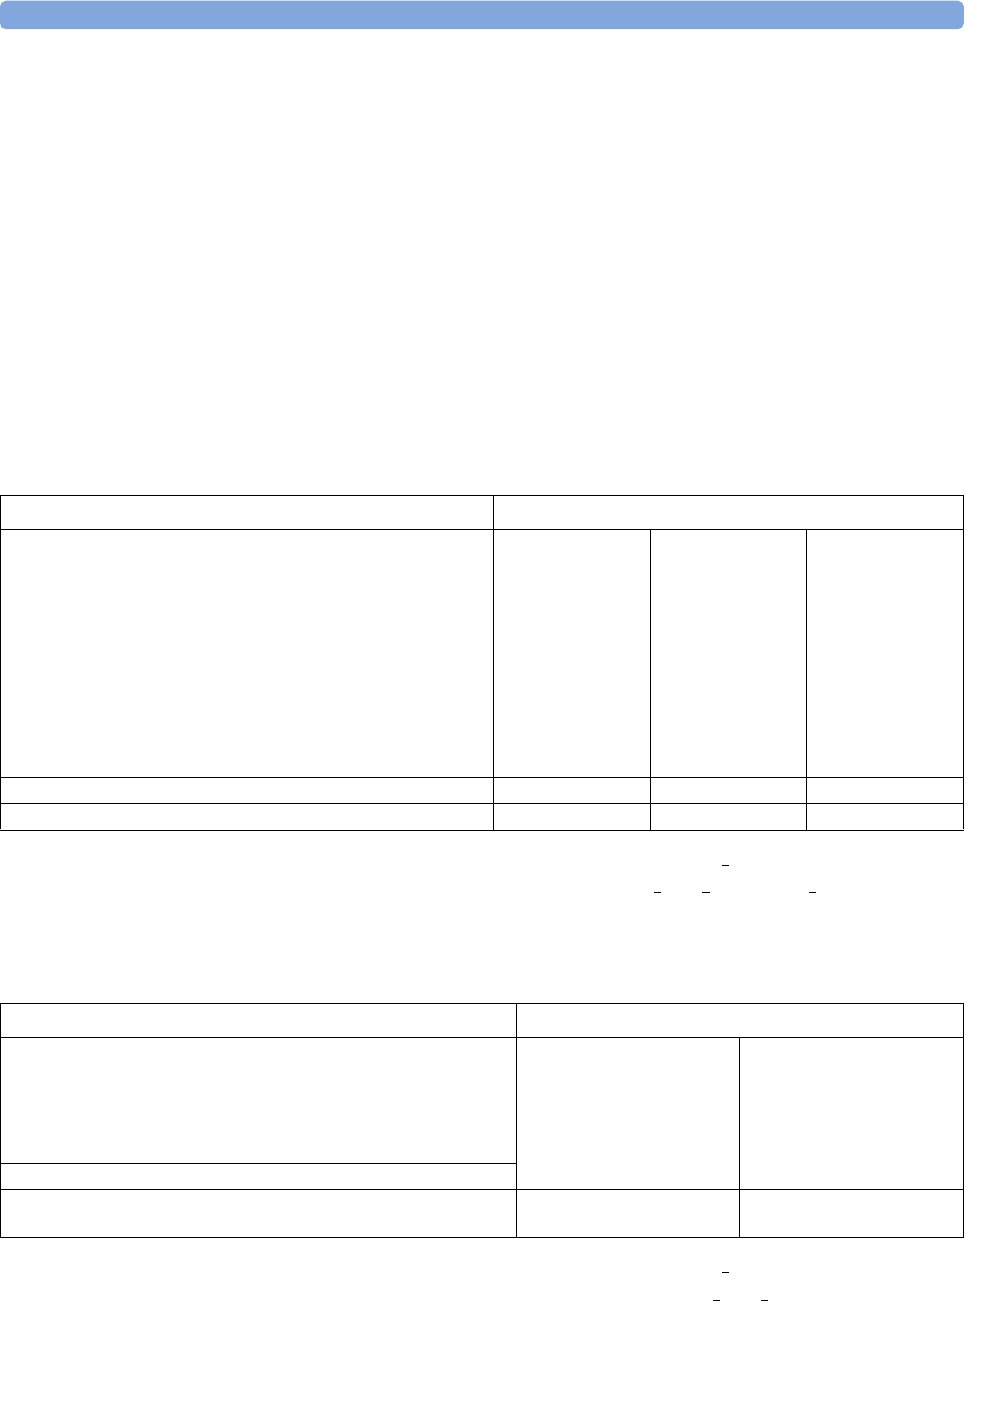
Signal-to-Total-Source Spontaneous Emission - 81640A
Output 1, Low SSE
Center Wavelength of Fiber Bragg Grating: TLS_λ
0
= ________ nm
OSA_λ
0
= ________ nm
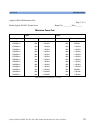
Transmission Band Limits: OSA_λ
1
= ________ nm
OSA_λ
2
= ________ nm
OSA_λ
3
= ________ nm
OSA_λ
4
= ________ nm
Measurement Uncertainty: ± 2.00 dB
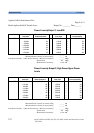
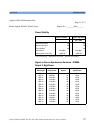
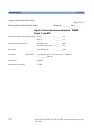
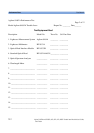
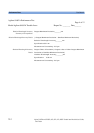
Optional Test - Signal-to-Total-Source Spontaneous
Emission - 81640A Output 2, High Power
Measurement Uncertainty: ± 2.00 dB
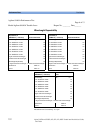
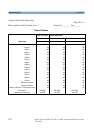
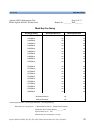
Output 1, Low SSE
OSA_noise _________ pW
Sum of all SSE power levels
in lower transmission band
_________ pW
Sum of all SSE power levels in upper transmission band _________ pW
power_trans
= Sum of all SSE power levels in transmission bands
_________ pW
power_att _________ pW
power_total_noise = power_trans + power_att _________ pW
Peak_power
Measurement Result - Total SSE _________ dB
Specification 55 dB
Total SSE 10
peak power
power total noise OSA noise–
------ -------------------------------------------------------------------------------log×=
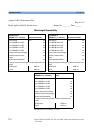
Output 2, High Power
OSA_noise _________ pW
SSE_power_λTLS_max _________ pW
Power_total_noise = OSA_noise + SSE_power_λTLS_max
_________ pW
Peak_power _________ pW
Measurement Result - Total SSE _________ dB
Specification 22 dB
(27 dB typical)
Total SSE 10
peak power
power total SSE
--------- -------------------------------------log×=