


CHAPTER 2: ELECTRICAL BACKGROUND
EPM 6000 MULTI-FUNCTION POWER METERING SYSTEM – USER GUIDE 2–11
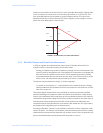
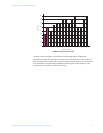
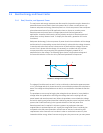
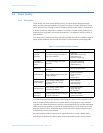
The following figure illustrates another example of energy and demand. In this case, each
bar represents the energy consumed in a 15-minute interval. The energy use in each
interval typically falls between 50 and 70 kWh. However, during two intervals the energy
rises sharply and peaks at 100 kWh in interval #7. This peak of usage will result in setting a
high demand reading. For each interval shown the demand value would be four times the
indicated energy reading. So interval 1 would have an associated demand of 240 kWh/hr.
Interval #7 will have a demand value of 400 kWh/hr. In the data shown, this is the peak
demand value and would be the number that would set the demand charge on the utility
bill.
FIGURE 2–8: Energy Use and Demand Intervals
As seen in this example, it is important to recognize the relationships between power,
energy and demand in order to effectively control loads or to correctly monitor use.
0
20
40
60
80
100
12345678
Intervals (15 mins.)
kilowatt-hours