Instructions
ELK - BLT
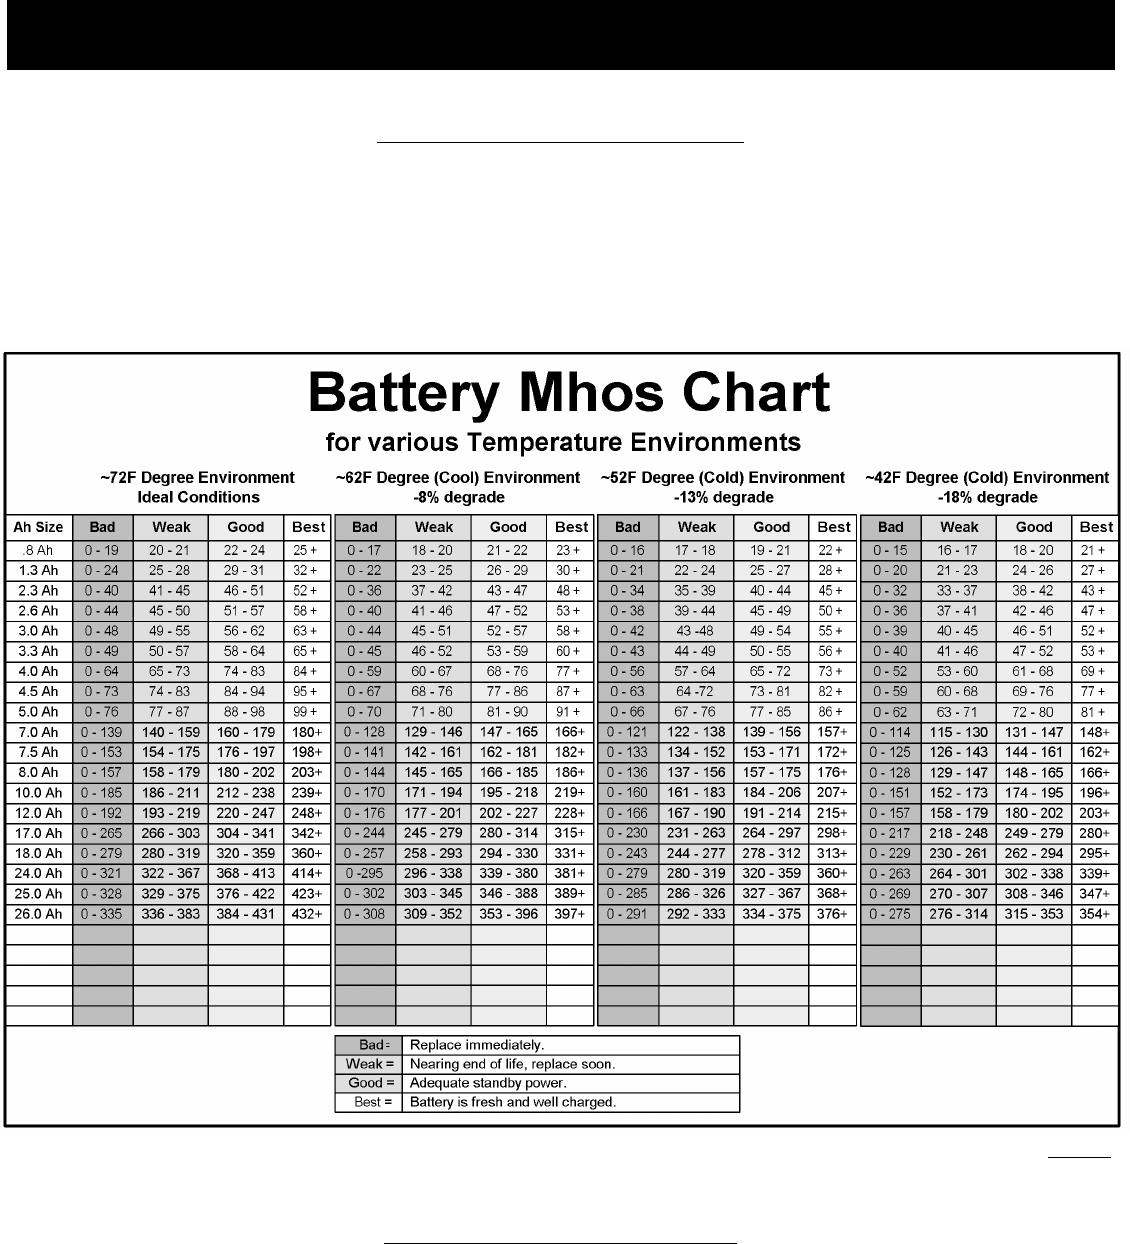
How Temperature affects a Battery
Generally speaking, temperatures below 72F degrees tend to slow down a battery’s internal activity, causing a significant decrease
in the Mhos (conductivity) reading as the temperature falls. Cool temperatures (not below freezing) will tend to prolong a battery’s
life. Temperatures above 72F cause a battery’s internal activity to accelerate, but with only a slight increase in the Mhos reading.
Warm temperatures will tend to dry out and degrade a battery much faster than normal.
100 F degrees = 105 % of normal Mhos (conductivity) 52 F degrees = 87 % of normal Mhos (conductivity)
72 F degrees = 0 % no adjustment 42 F degrees = 82 % of normal Mhos (conductivity)
62 F degrees = 92 % of normal Mhos (conductivity) 32 F degrees = 76 % of normal Mhos (conductivity)
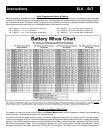
ELK Products is not responsible for misprints or errors. These Mhos values are benchmark averages, created from fresh samples of major brand batteries. If you find consistent,
minor variations in readings from multiple samples of a battery, it’s likely due to manufacturing differences. However, if the readings are excessively low, the battery is not as good
as the benchmark average. If this chart does not include the battery you are testing, it may be necessary to generate the values using the procedure below.
Adding to the Battery Mhos Chart
If the battery you are trying to test is not included in the Battery Mhos Chart it may be necessary to research and generate the
data on your own. The following procedure will help with this task.
Start with 2 or 3 fresh new batteries out of the box. The battery voltage should be around 12.6 Volts or higher. Place the batteries
in service (on charge) for 24 hours. Remove them from charge and measure the Mhos reading of each one. Average the readings
together. This will be the baseline number from which the Best, Good, Weak, and Bad columns are calculated. The “Best” column
will be 90% of the baseline number. The first and second numbers in the “Good” column are 80% and 89% of the baseline. The first
and second numbers in the “Weak” column are 70% and 79% of the baseline. The “Bad” column is 0% and 69% of the baseline.


