


4
2. Application and
Procedures
Sensitometer Monitoring For
Process Control
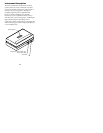
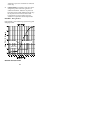
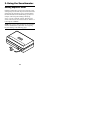
The sensitometer exposes film with a known quantity of
light through a 21-step light modulator. The maximum
light is emitted from Step No. 21. Each successive step
emits approximately 70.7% of the light emitted from the
step adjacent to it (.15 log exposure). The processed
film responds to this exposure in a predictable manner.
A plot of optical density—measured on the processed
film—against relative log exposure values is known as
the D-Log E curve. Figure One shows the response of a
typical radiographic film to exposure with the
sensitometer. The portion of the curve that changes
most with variations in processing is called the “straight
line portion” of the curve.
It is not necessary to plot D-Log E Curves to monitor
automatic processors in normal laboratory
environments. A simpler method is to record the three
parameters from the D-Log E Curve which contain
most of the data.
The following three parameters on the curve should be
monitored to give pertinent processing data.
• Base+Fog: Step No. 1 on the D-Log E Curve is
called Base+Fog the least exposed portion of the
film. It is the base support density plus any silver
emulsion density developed in the area where
negligible exposure should occur.
• Speed Index: The step on the exposed film with a
density nearest 1.OD+ Base+Fog is called Speed
Index. This step is a direct indicator of film speed.