For Machines Mfg. Since 8/09 Model SB1021/SB1022
-25-
OPERATION
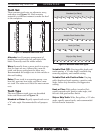
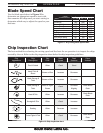
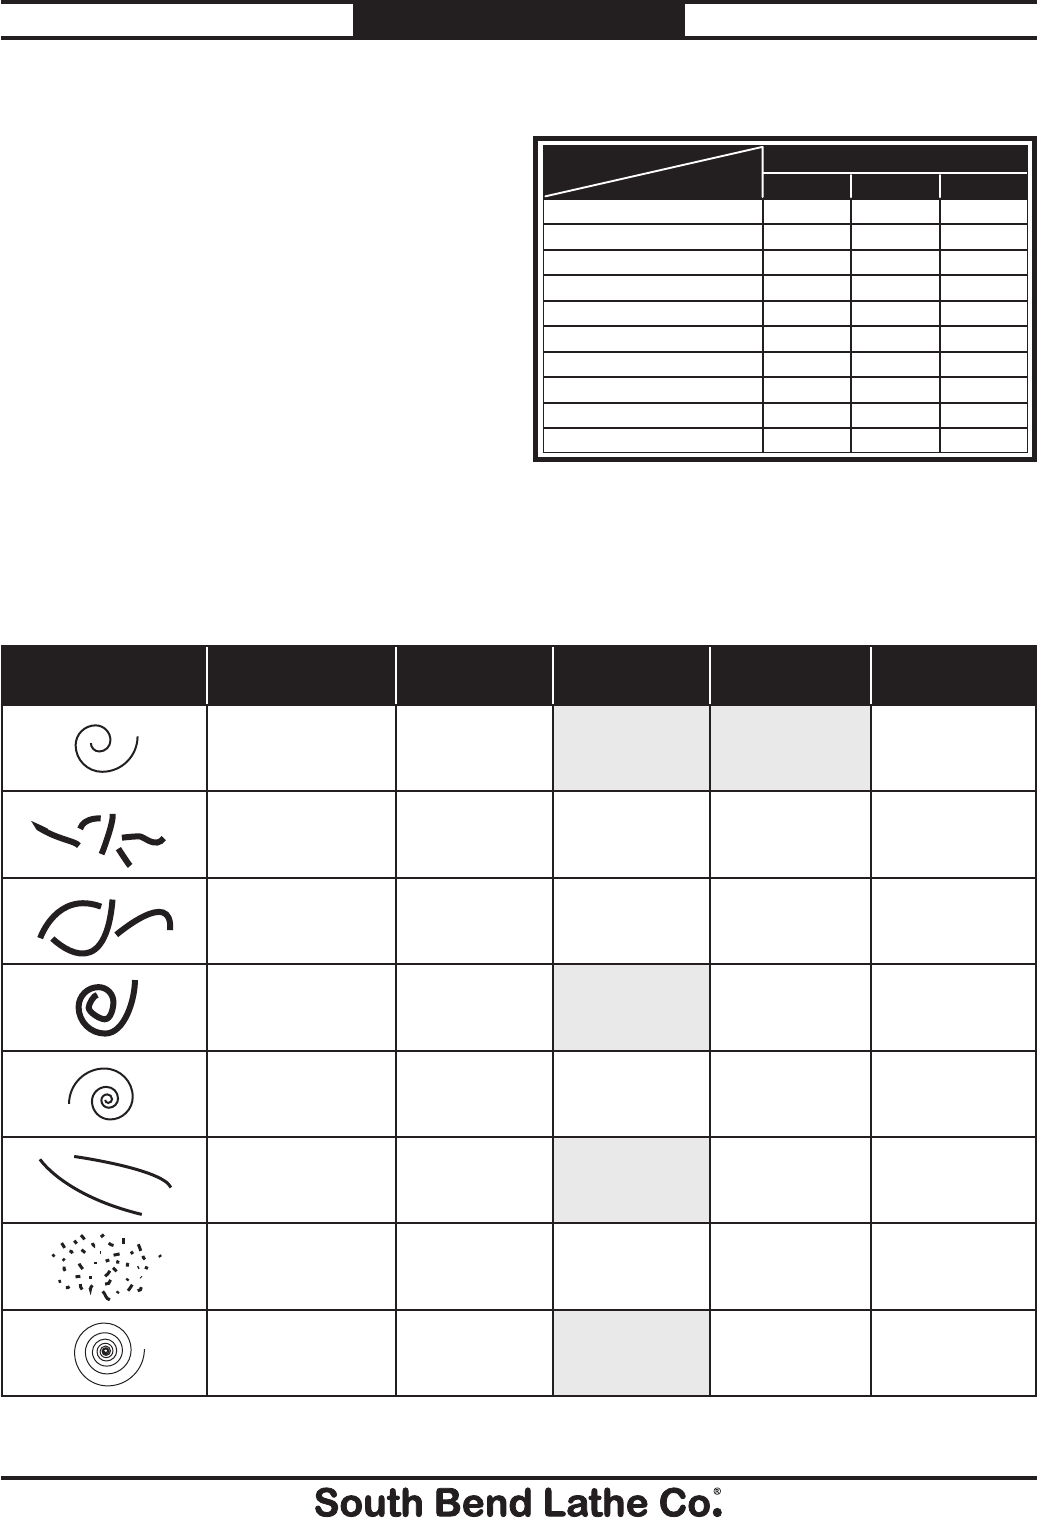
Use the blade speed chart in Figure 15 to
determine an appropriate speed to start with,
then examine the chips once you start cutting to
determine which way to adjust the speed or your
feed rate.
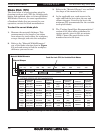
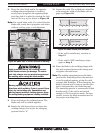
The best method for evaluating the cutting speed and feed rate for an operation is to inspect the chips
created by the cut. Refer to the chip inspection chart below for chip inspection guidelines.
Chip
Appearance
Chip
Description
Chip
Color
Blade
Speed
Feed
Pressure
Other
Actions
Thin & Curled Silver Good Good
Hard, Thick &
Short
Brown or Blue Increase Decrease
Hard, Strong &
Thick
Brown or Blue Increase Decrease
Hard, Strong &
Thick
Silver or Light
Brown
Good
Decrease
Slightly
Check Blade
Pitch
Hard & Thin Silver Increase Decrease
Check Blade
Pitch
Straight & Thin Silver Good Increase
Powdery Silver Decrease Increase
Curled Tight & Thin Silver Good Decrease
Check Blade
Pitch
Figure 16. Chip inspection chart.
Chip Inspection Chart
Blade Speed Chart
Figure 15. Dry cutting blade speed chart.
Alloy Steel 90 125 160
Aluminum 185 250 315
Brass (Soft) 375 500 625
Brass (Hard) 150 200 250
Bronze 150 200 250
Copper 185 250 315
Cast Iron 90 125 160
High Speed Steel 35 50 65
Low Carbon Steel 90 125 160
Medium Carbon Steel 75 100 125
Material
Thickness
0 - 1/2" 1/2" - 1" 1" +
Dry Cutting Speed (FPM)


