OM-499 Page 13
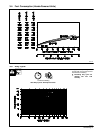
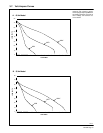
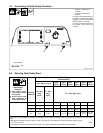
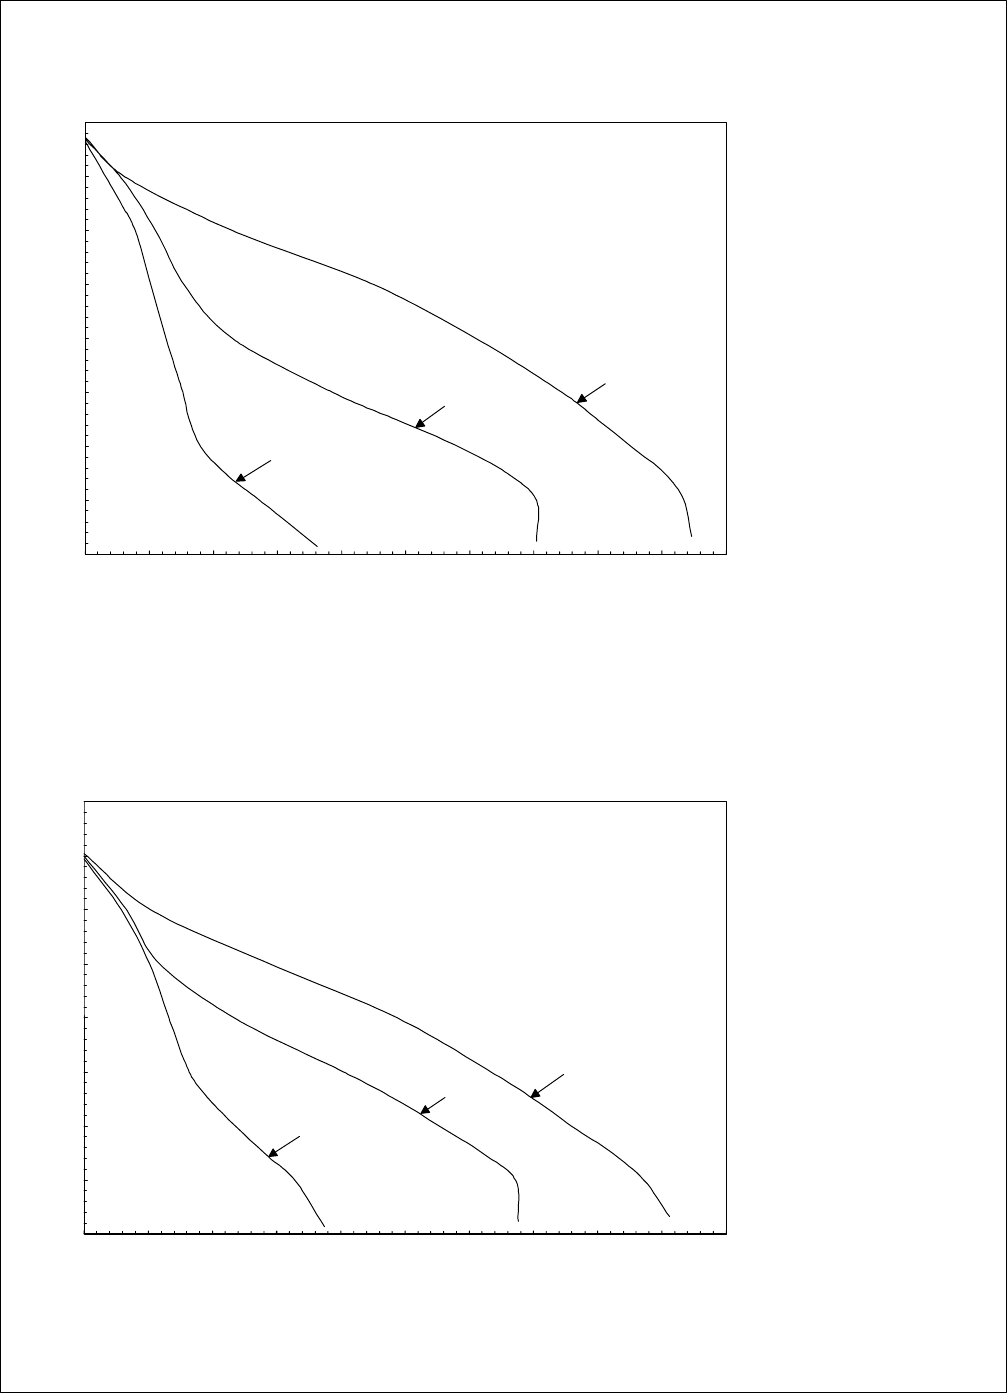
3-7. Volt-Ampere Curves
198 570
The volt-ampere curve shows the
minimum and maximum voltage
and amperage output capabilities o
f
the welding generator. Curves of al
l
other settings fall between the
curves shown.
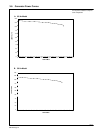
A. 60 Hz Model
B. 50 Hz Model
0
10
20
30
40
50
60
70
80
0 25 50 75 100 125 150 175 200 225 250
LOAD AMPS
LOAD VOLTS
MIN
MID
MAX
0
10
20
30
40
50
60
70
80
0 25 50 75 100 125 150 175 200 225 250
LOAD AMPS
LOAD VOLTS
MIN
MID
MAX


