


© National Instruments Corporation 19 NI Spectral Measurements Toolkit User Guide
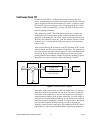
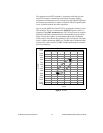
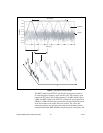
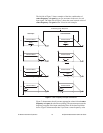
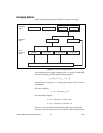
The left side of Figure 7 shows examples of the four combinations of
center frequency and span that you can encounter in the case of a real
input signal. The right side of Figure 7 shows the actual coerced values of
center frequency and span that the VI sets in each example.
Figure 7. Center Frequency and Span Combinations
Figure 7a demonstrates that if you enter appropriate values for both center
frequency and span, the values do not change. The spectrum represents the
frequency response of the input antialiasing filter on the data acquisition
device. Figure 7b demonstrates that if you enter a center frequency value
Effective Band
f
l
Span
f
c
f
h
f
s
/2
Effective Band
Span
f
l
f
c
f
h
f
s
/2
Effective Band
Span
f
l
f
c
f
h
f
s
/2
Effective Band
Span
f
l
f
c
f
h
f
s
/2
Effective Band
Span
f
l
f
c
f
h
f
s
/2
Effective Band
f
l
f
h
f
s
/2
Effective Band
f
l
Span
f
c
f
h
f
s
/2
Effective Band
Span
f
l
f
c
+f
h
f
s
/2
Antialiasing Filter Response
Span
f
c
= (f
l
+ f
h
)
2
a.
b.
c.
d.
User Input
Coerced Result