


© National Instruments Corporation 29 NI Spectral Measurements Toolkit User Guide
Averaged Frequency Response
If you have a stimulus to a system with spectrum X
and the system
response Y, the frequency response H of the system is shown by the
following equation:
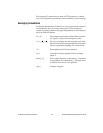
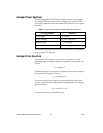
You can use the equations shown in the following table to obtain the vector
and RMS averaged frequency response.
Frequency response has no peak-hold average.
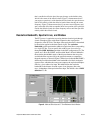
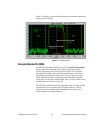
Spectral Domain Measurements
The Spectral Measurements Toolkit contains tools that perform power
measurements such as power-in-band, adjacent channel power, and
occupied bandwidth. The Spectral Measurements Toolkit also contains
VIs that perform searches for single or multiple peaks in a spectrum.
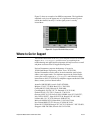
Unit Conversion
You can represent the magnitude scale of a spectrum in many ways,
depending on the nature of the measured signal and the aspect of the signal
that you need to quantify. The SMT Spectrum Unit Conversion VI converts
and scales a spectrum to the representation you need for your application.
Unit conversion always returns a real spectrum without phase information.
The basic units associated with a spectrum are volts (V) and watts (W).
Watts must always be associated with a specific impedance. If you do not
know the impedance, you cannot specify the power in watts. Power
spectrum units are typically volts squared (V
2
). If you assume an
impedance of 1 Ω, you can represent the same power spectrum in watts.
Volts and watts use either a linear or logarithmic scale. Logarithmic scales
are in units such as dBV, which means the magnitude of the spectrum is in
dB with a reference level of one volt.
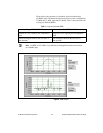
Table 4. Averaged Frequency Response Settings and Equations
Setting Equation
RMS averaging H = <Yconj(X)> / <X conj(X)>
Vector averaging H = <Y>/<X>
H
Y
X
---=