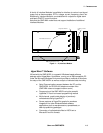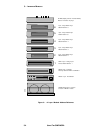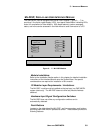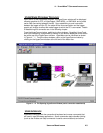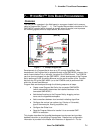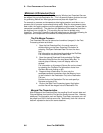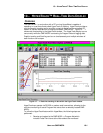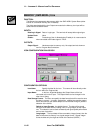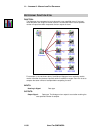
9... HYPERPLOT™ GRAPHIC DATA DISPLAY
USING THE OMP-MODL 9-5
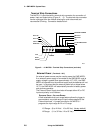
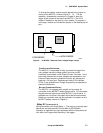
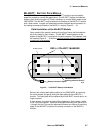
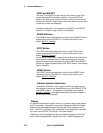
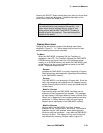
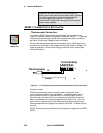
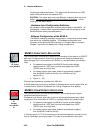
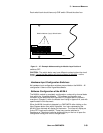
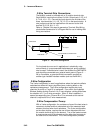
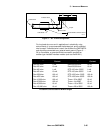
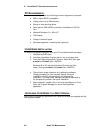
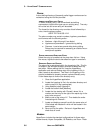
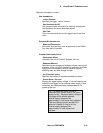
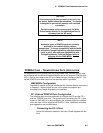
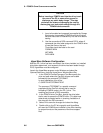
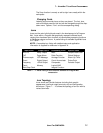
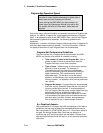
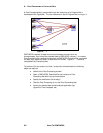
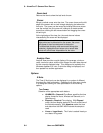
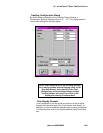
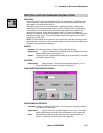
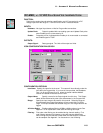
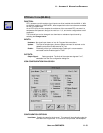
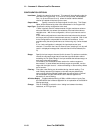
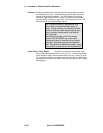
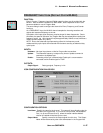
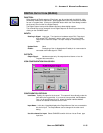
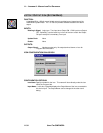
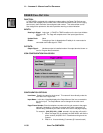
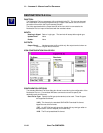
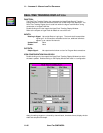
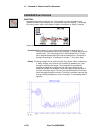
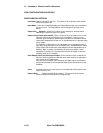
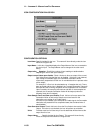
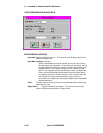
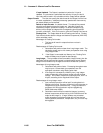
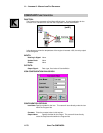
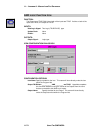
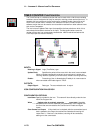
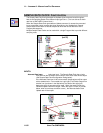
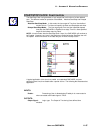
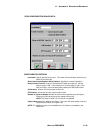
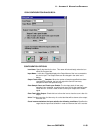
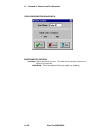
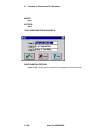
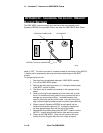
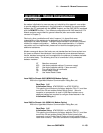
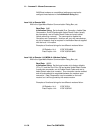
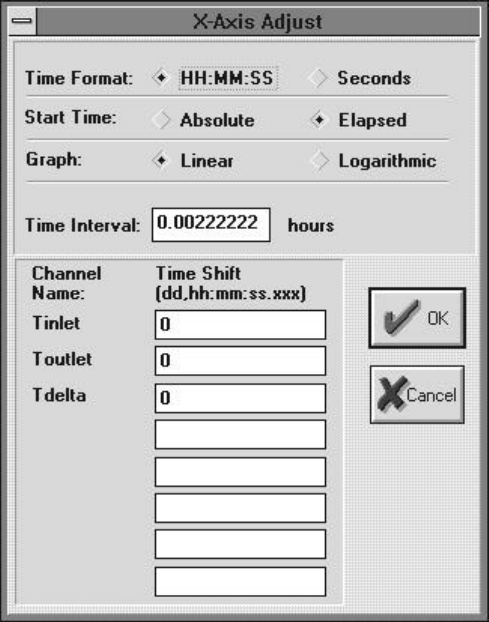
TIME INTERVAL
Using the provided Time Interval text box, the time base
(essentially a manual time base zoom function) can be manually
specified. The entered value in units (approximate) will be used
for the time window displayed in a single view. For example, if
the value is entered as 60, the HyperPlot view will be time
zoomed to display approximately 60 units (seconds, hours, etc)
in a single full screen view.
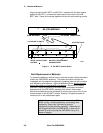
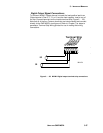
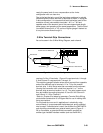
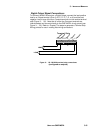
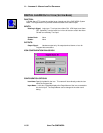
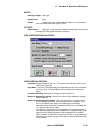
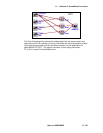
TIME SHIFT
Individual channel plots can be shifted in time from milliseconds
to days. Following the example format, in a Channel’s text box,
enter in the time to shift that plot.
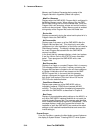
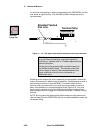
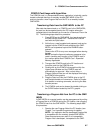
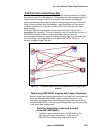
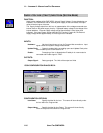
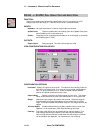
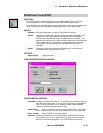
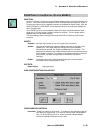
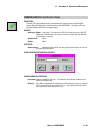
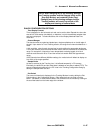
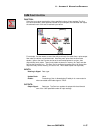
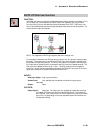
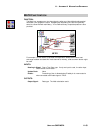
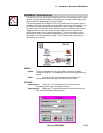
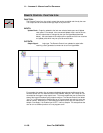
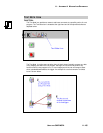
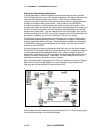
The Time Shift capability can be very convenient for time
registering (aligning) plots of data within a Before / After Merged
file for easy graphic comparison. Refer to Chapter 8 for details
on generating a Merged file.
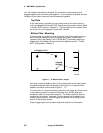
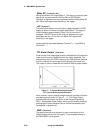
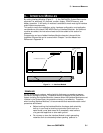
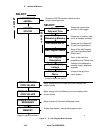
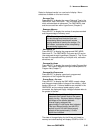
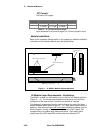
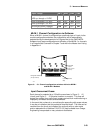
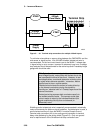
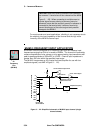
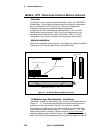
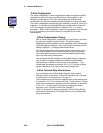
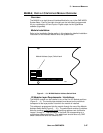
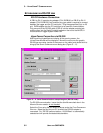
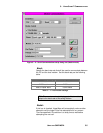
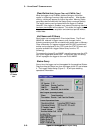
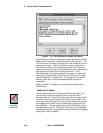
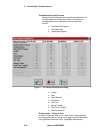
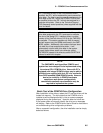
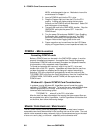
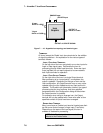
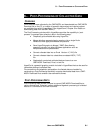
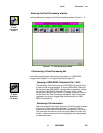
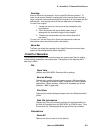
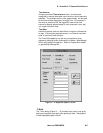
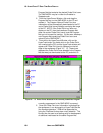
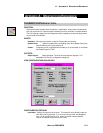
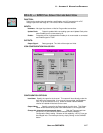
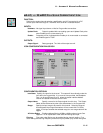
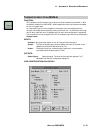
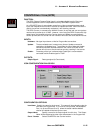
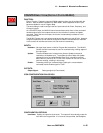
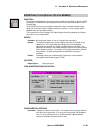
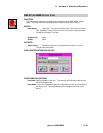
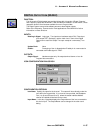
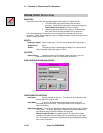
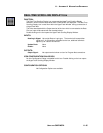
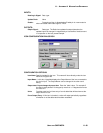
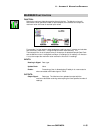
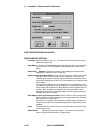
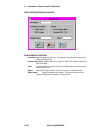
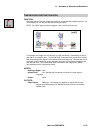
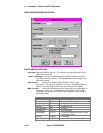
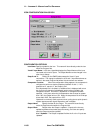
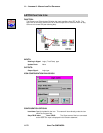
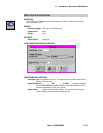
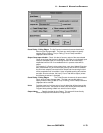
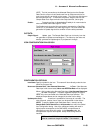
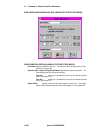
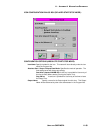
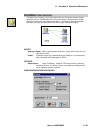
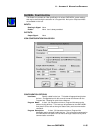
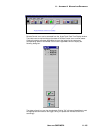
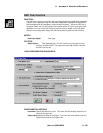
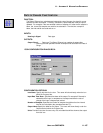
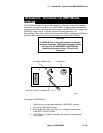
Y-Axis
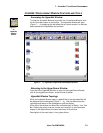
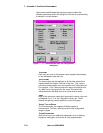
The Y-Axis dialog (Figure 9... -5) provides User control over grids,
scaling and symbols used during the plotting of data. Descriptions
of User selectable options follow:
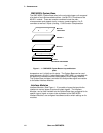
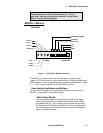
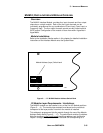
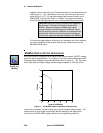
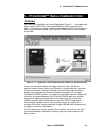
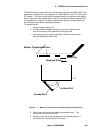
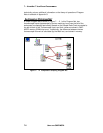
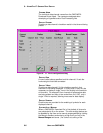
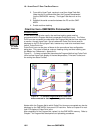
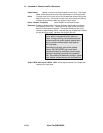
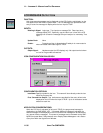
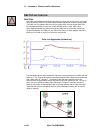
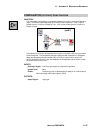
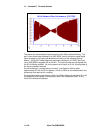
Figure 9... -4: HyperPlot Options / X-axis