


Page 5
Monitor Measurements in Real-Time
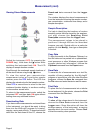
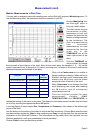
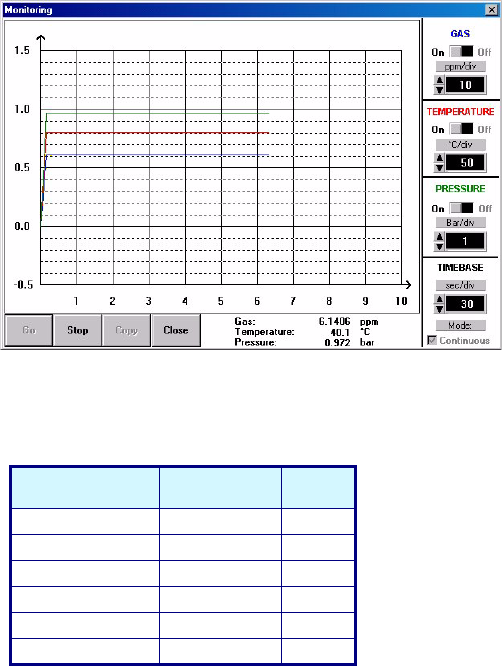
You may wish to analyze a particular sampling point via the WinLog97 program's Monitoring menu. To
use this Monitoring chart, the instrument must be connected to your PC.
Choose Monitoring from
the WinLog97 menu to
bring up a chart display.
The chart shows the gas
concentration (in blue),
temperature (in red), and
pressure (in green) as the
sample is being measured
by the instrument. The
chart is updated directly
from instrument
measurements, at a rate
determined by the time
scale set in the
TIMEBASE box at the
lower right corner of the
chart.
Click the TIMEBASE up/
down pointers to change
the time scale of the divisions of the chart. Each division mark along the baseline (1, 2, ...10) can be
made to represent from 30 seconds to 2½ hours, providing from 5 minutes to 25 hours of continuously
displayed samples (as illustrated in the table).
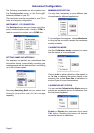
Click on the Continuous box to enable or
disable continuous charting. When this box is
checked, the chart scrolls continuously after
reaching the 10 division, and the oldest
samples are lost off the left of the chart.
When Continuous is not checked, the chart
stops displaying new results after reaching
the 10 division, and all subsequent
measurements are lost.
Click the up/down pointers for each
measurement variable (GAS,
TEMPERATURE and PRESSURE) to
change the scaling of that value on the chart. The display of each measurement variable may be turned
on or off by choosing the appropriate On or Off switch.
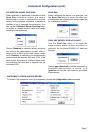
A running display of latest sample Gas, Temperature and Pressure is also shown in the bottom-right
corner of the chart.
Use the buttons at the bottom of the chart to control real-time monitoring. Choose Go to clear the chart
and start real-time monitoring, Stop to stop monitoring and Copy to copy the data from the chart as text
information to the Windows Clipboard. This information can be pasted from the clipboard into any
Windows application, such as a spreadsheet or word processor.
Choose Close to close the Monitoring window.
Measurement (cont)
Timebase Updating Rate Max.
Samples
30 Seconds/Division 5 Secs/Sample 60
1 Minute/Division 5 Secs/Sample 120
10 Minutes/Division 5 Secs/Sample 1,200
30 Minutes/Division 9 Secs/Sample 2,000
1 Hour/Division 18 Secs/Sample 2,000
2.5 Hours/Division 45 Secs/Sample 2,000