


4.1 INTRODUCTION
The following describes the ArcScope application included with Wave Designer Pro. The
ArcScope application provides oscilloscope type displays of power source output waveforms on
your computer monitor.
4.1.1 USING THE ARC SCOPE WINDOW
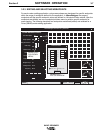
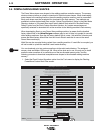
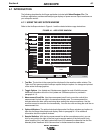
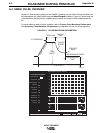
Refer to the ArcScope window in Figure 4-1 and the related window usage instructions.
FIGURE 4-1. ARC SCOPE WINDOW.
Section 4 4-1
ARCSCOPE
WAVE DESIGNER
File Tools Print Help
Off Line Stand by
Status
AC.sco loaded
No Adapt
Wave Designer Pro Off Line - pulse.swf
ARC SCOPE
Live Update
Condense
9ROW
$PS
G,GW
2KP
:DWW
Browse >
Browse <
Let Go
Configure ...
0.0 Volt
0 Amp
0.0 KW
0.0 Hz
0.0 KJ
0.0 Sec
3.5 ms, 285.7 Hz
1077.6 Joule
25
0
700
350
30
2000
0
-2000
1
.5
0
15000
7500
0
0 10203040
1
2
5
7
6
3
4
MEASUREMENT
LINE
27850023
1. Tool Bar The tool bar is the same tool bar displayed in the waveform editor window. The
Tools and Print menus provide ArcScope capture and print options for storage and printout
of the active ArcScope graphics.
2. Toggle Options
Live Update
and
Condense
are toggled on and off with the mouse.
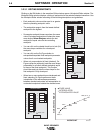
Additional information about the
Live Update
and
Condense
options is provided in
paragraph 4.1.2.
3. Measurement Scroll Bar Use the measurement scroll bar to move the vertical blue
measurement line left and right in the waveform display area. The measurement line
indicates where the data values are being taken among the various waveforms. Use the
scroll bar arrows to move the line incrementally. You can also click and drag the scroll bar or
measurement line.
4. Optional Windows The optional window buttons select ArcScope windows and options to
tailor the ArcScope data sample and display. Refer to paragraph 4.1.2 for additional
information about the optional windows.
5. Sample Statistics With the blue measurement line at the zero reference point, you can
click on any point to the right of the line to get a sample readout of the time period (ms),
pulse frequency (Hz), and weld system heat input (kJ) between the reference line and the
selected points measured: N/A is shown when no measurement has been taken.