M-GAGE
®
S18M — Vehicle Detection Sensor
6 P/N 114430 rev. A
Banner Engineering Corp. • Minneapolis, MN U.S.A.
www.bannerengineering.com • Tel: 763.544.3164
P/N 114430 rev. A 7
M-GAGE
®
S18M — Vehicle Detection Sensor
Banner Engineering Corp. • Minneapolis, MN U.S.A.
www.bannerengineering.com • Tel: 763.544.3164
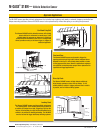
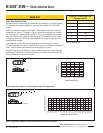
Excess Gain
Typical Target Excess Gain Curves
Once the sensor has been securely mounted and is configured, it is ready to operate.
The following two example applications show typical responses for the M-GAGE
sensor.
Example 1 describes mounting the M-GAGE 1 meter above the ground to sense an
automobile; see Figure 5. The graph in Figure 5 shows the excess gain for a typical
car. Excess gain is a measure of the amount of “extra” signal detected by the sensor
over and above the level needed to detect the target. This example assumes a level
5 sensitivity threshold. The table at right compares the change in excess gain if the
sensitivity level changes.
If the sensitivity is at level 6, then the excess gain at a given distance would be
1.3 times larger than for a level 5 sensitivity. Conversely, if the sensitivity threshold is
level 1, then the excess gain would be one third as big as for level 5.
Example 2 (see Figure 6) illustrates a typical vehicle passing over a sensor mounted
underground. Note that excess gain is greatest when the bulk of the vehicle (the rear
axle) is positioned directly over the sensor.
Figure 6. Application example 2: sensor mounted 0.25 meters (0.8') below ground
Figure 5. Application example 1: sensor mounted 1 meter (3.2') above ground
2.5 m
(8.0')
2.0 m
(6.4')
1.5 m
(4.8')
1.0 m
(3.2')
0.5 m
(1.6')
0
Distance from Vehicle Side
Excess Gain
(Sensitivity Level 5)
0
1
2
3
4
5
6
7
8
Excess Gain vs Sensitivity Level
(Assumes Level 5)
Level Excess Gain Multiplier
1
0.33
2
0.4
3
0.5
4
0.66
5*
1.0
6
1.3
*Factory default setting


