Specifications
A–6 975-0337-01-01
Rating Curves and Charging Profiles
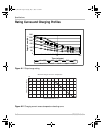
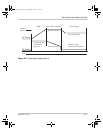
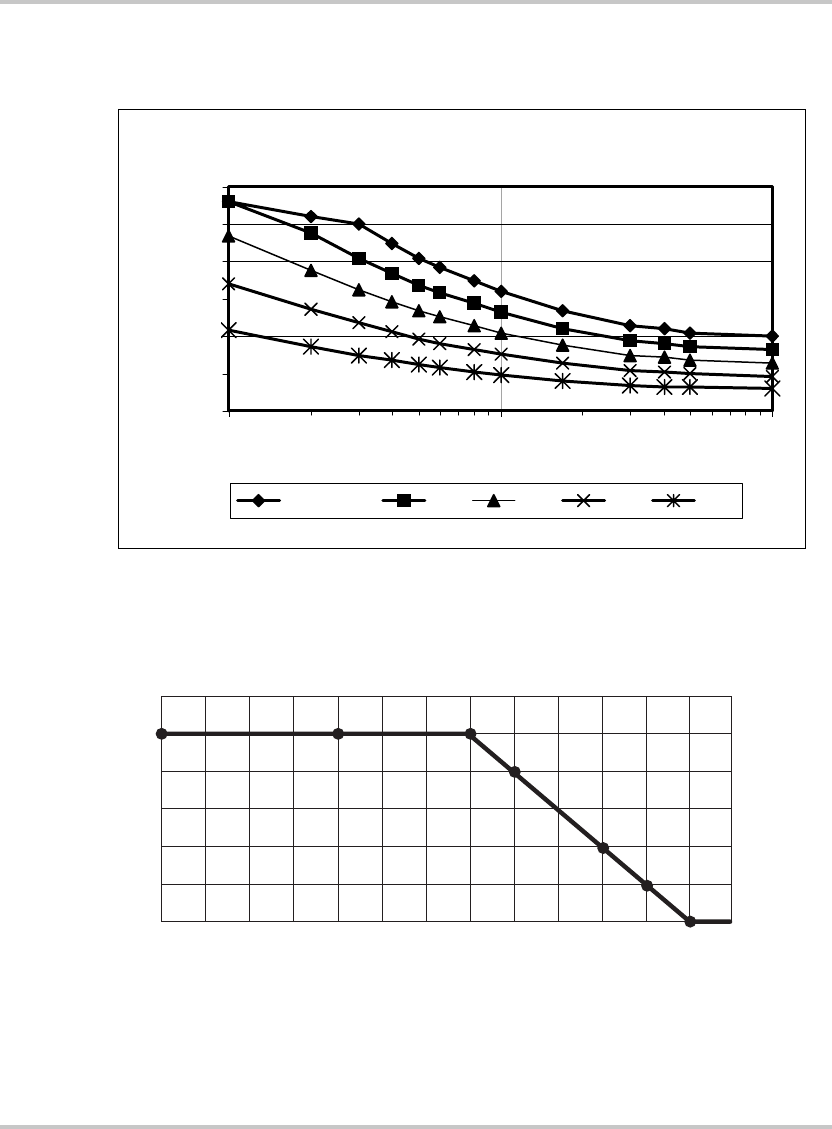
Figure A-1
Output surge rating
Figure A-2
Charging current versus temperature derating curve
0
500
1000
1500
2000
2500
3000
1 10 100
Time (minutes)
Output Power (VA)
-40 to 25C 40C 55C 70C 85C
104 F
131 F
158 F
185 F
–
40 to 77 F
Maximum charger current vs. Temperature
Charger current (Amps)
Ambient temperature ( °C)
-40 -20 0
20
40 60 80
0
10
20
30
40
50
60
IP1012_AL.book Page 6 Tuesday, May 1, 2007 12:18 PM


