


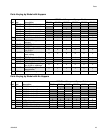
Pump Performance Charts
3A0420H 49
Pump Performance Charts
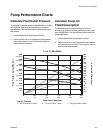
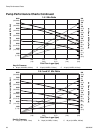
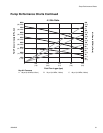
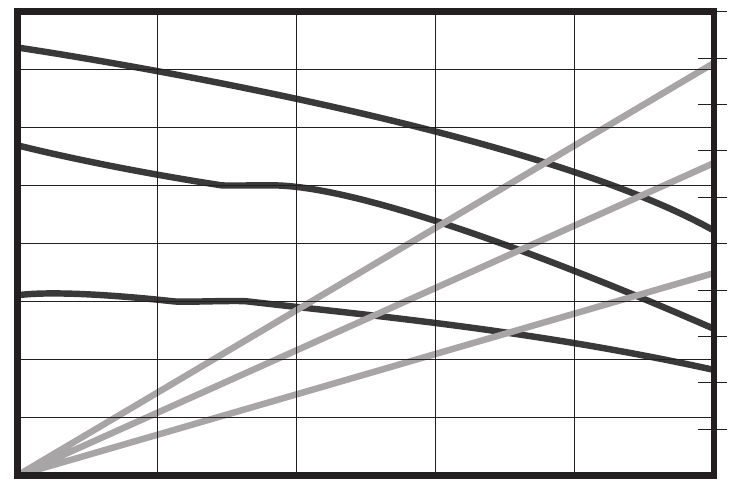
Calculate Fluid Outlet Pressure
To calculate fluid outlet pressure (psi/MPa/bar) at a spe-
cific fluid flow (gpm/lpm) and operating air pressure
(psi/MPa/bar), use the following instructions and pump
data charts.
1. Locate desired flow along bottom of chart.
2. Follow vertical line up to intersection with selected
fluid outlet pressure curve. Follow left to scale to
read fluid outlet pressure.
Calculate Pump Air
Flow/Consumption
To calculate pump air flow/consumption (scfm or
m
3
/min) at a specific fluid flow (gpm/lpm) and air pres-
sure (psi/MPa/bar), use the following instructions and
pump data charts.
1. Locate desired flow along bottom of chart.
2. Follow vertical line up to intersection with selected
air flow/consumption curve. Follow right to scale to
read air flow/consumption.
Fluid Pressure in psig (MPa, bar)
1:1 or 2:1 Mix Ratio
Key:Air Pressure
A 95 psi (0.65 MPa, 6.5bar) B 70 psi (0.5 MPa, 7.8 bar) C 40 psi (0.3 MPa, 2.8 bar)
Air Flow in SCFM (m
3
/min)
200
(5.6)
180
(5)
160
(4.4)
140
(3.9)
120
(3.3)
100
(2.8)
80
(2.2)
60
(1.6)
40
(1.1)
20
(0.5)
8000
(56, 560)
7000
(49, 490)
6000
(42, 420)
5000
(35, 350)
4000
(28, 280)
3000
(21, 210)
2000
(14, 140)
1000
(7, 70)
00.5
(1.9)
1.0
(3.8)
1.5
(5.7)
2.0
(7.6)
2.5
(9.5)
Fluid Flow in gpm (lpm)