


– 19 –
OPERATION
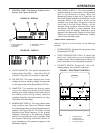
A. AC/DC INDICATOR: This symbol represents the
output polarity of the 255 . . . either AC or DC. AC
is shown in Figure 4A; DC is shown in Figure 4B.
B. VOLTMETER: This meter displays open circuit
voltage as well as welding voltage, as measured
on the output studs of the Square Wave TIG 255.
C. AMMETER: The ammeter can display preset
current (for setting the welding current before
welding) and actual welding current (the value of
the welding current during a weld). Read the
complete Operating Instructions section for more
information on the ammeter.
D. MOMENTARY DISPLAY: This area is blank under
most conditions; see Figure 4A. Different values
may be displayed here as certain keypad keys are
pressed. See Figure 4B; the TIG Pulser is being
adjusted, so the Pulse Frequency, 2.0 Hz, is being
displayed. Information in the Momentary Display
lasts for five seconds after a key is pressed. Read
the complete Operating Instructions section for
more information on the values that appear in the
Momentary Display.
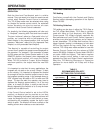
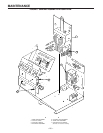
CASE FRONT CONTROLS
Refer to Figure 5 for the location of the following
controls:
1. POWER SWITCH: Controls the input power to the
Square Wave TIG 255.
2. OVER TEMPERATURE LIGHT: A yellow light
which only lights when an over temperature
situation occurs. See the Maintenance Section for
more information on the thermostatic protection.
3. POLARITY SWITCH: Selects DC+, AC or DC-
welding polarity. Do not switch under load.
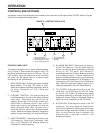
7. CONTROL PANEL: The display is divided into five
sections. See Figures 4A and 4B.
FIGURE 4A - DISPLAY
A. AC/DC INDICATOR D. MOMENTARY DISPLAY
B. VOLTMETER E. BAR GRAPH
C. AMMETER
FIGURE 4B - DISPLAY
A
B
C
D
E
E. BAR GRAPH DISPLAY: This area provides a
graphical display of values shown on the Ammeter
and on the Momentary Display. When the
Momentary Display is blank (as in Figure 4A), the
Bar Graph Display represents values shown on the
ammeter. When a low value is shown on the
ammeter, only a few “bars” will appear on the left
hand side of the Bar Graph Display. As the
ammeter value increases, more and more “bars”
will appear. Whenever a value increases, more
and more “bars” will appear. Whenever a value
appears in the Momentary Display, the Bar Graph
Display will represent the Momentary Display
value, not the ammeter value.
FIGURE 5 - CASE FRONT CONTROLS
1. POWER SWITCH
2. THERMOSTATIC
PROTECTION LIGHT
3. POLARITY SWITCH
DC
DC
AC
O
I
POWER
WARNING
ELECTRODE
WORK
GAS
IN
OUT
WATER
IN
OUT
DO NOT SWITCH
WHILE WELDING
L9119-1
L9119-2
REMOTE
1
2
3