


84
MODEL 54eA SECTION 15.0
CALIBRATION - CONTROL
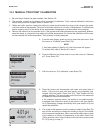
concentration, temperature) compared to the measurement range, the difference between the 20 mA (Hi) and 4
(or 0) mA (Lo) setpoints, which you determined when configuring the analog output.
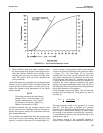
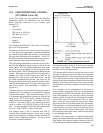
In the example shown in Figure 15-1:
The percent change in pH was:
x 100% = = 33.3%
The change in the output signal was:
x 100% = 12.5%
So the Plant Gain is:
C = = 2.66
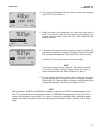
Once R and C are calculated, the proportional and integral bands can be determined as follows:
Proportional band (%) = P = 286
Integral Time (seconds per repeat) = I = 3.33 x D x C
So for the example:
P = = 254%
I = 3.33 (4 sec.) 2.66 = 36 seconds
To enter these parameters, use the procedure detailed in Section 5.6.
pH2 - pH1
pH “Hi” - pH “Lo”
8.2 - 7.2 pH
9.0 - 6.0 pH
6 - 4 milliamps
20 - 4
33.3
12.5
C
R
286 (2.66)
3