


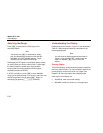

Getting Acquainted
Understanding the Display
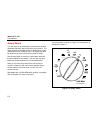
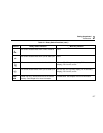
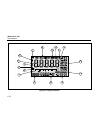
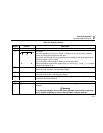
2
2-11
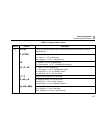
• dB (in ac volts functions): the dBm or dBV value.
• REL: the difference between the present reading and
a stored reference reading.
• Setup: various messages (see Chapter 5).
• Overload conditions: OL displayed.
• Error conditions.
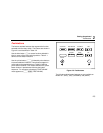
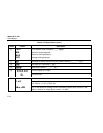
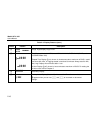
Secondary Display
The secondary display often shows the present reading
when the primary display shows some other feature (MIN
MAX, REL ∆, etc.)
When multiple features are active, the secondary display
shows one of the values. For example, Hz could appear in
the secondary display while dB appears in the primary
display.
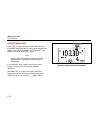
Bar Graph
The bar graph provides an analog indication of the
measured input. For most measurement functions, the bar
graph updates 40 times per second. Since this response
is much faster than the digital display, the bar graph is
useful for making peak and null adjustments and for
observing rapidly changing inputs. The bar graph is not
available in temperature, capacitance, ac over dc, dc over
ac, and ac+dc functions.