


39
CHAPTER
5
Monitoring Applications
The J2ME Wireless Toolkit provides several tools to monitor the behavior of your
applications. These tools are helpful in debugging and optimizing your code.
■ The profiler lists the frequency of use and execution time for every method in
your application.
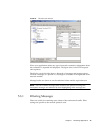
■ The memory monitor shows the usage of memory while your application runs.
■ The network monitor shows network data transmitted and received by your
application. It supports many network protocols including HTTP, HTTPS, SMS,
and CBS.
■ Tracing outputs low-level information to the KToolbar console.
Note – Monitoring features might slow down the execution of your application.
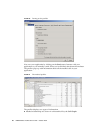
5.1 Using the Profiler
The profiler keeps track of every method in your application. For a particular run,
it figures out how much time was spent in each method and how many times each
method was called. After you finish running your application and shut down the
emulator, the profiler pops up, allowing you to browse through the method call
information.
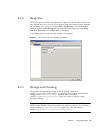
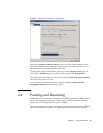
To turn on the profiler, choose Edit > Preferences... from the KToolbar menu. Click
on the Monitor tab. If you are interested in seeing profiling information for all the
system implementation methods, check Show System Classes. Otherwise, the
profiler shows only system methods that contain calls to your application methods.