


Chapter 5 Monitoring Applications 43
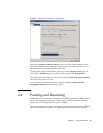
■ Maximum. The maximum amount of memory used since program execution
began, shown in the graph by a broken red line.
■ Objects. The number of objects in the heap.
■ Used. The amount of memory used.
■ Free. The amount of unused memory available.
■ Total . The total amount of memory available at startup.
Remember, you can modify the heap size using the Storage tab of the KToolbar
preferences. See Chapter 3, “Working With Projects,” for details.
To request the system to perform a garbage collection, click on Run GC.
Note – The memory usage you observe with the emulator is not going to be
exactly the same as memory usage on a real device. Remember, the emulator does
not represent a real device. It is just one possible implementation of its supported
APIs.
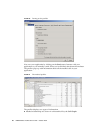
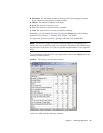
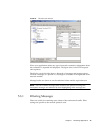
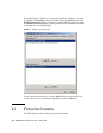
To see details about the objects in your application, click on the Objects tab in the
memory monitor window.
FIGURE 23 The memory monitor objects display
You’ll see a table with the following columns: