


44 J2ME Wireless Toolkit User’s Guide • October 2004
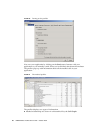
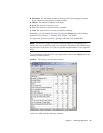
■ Name. The class name of the objects.
■ Live. The number of instances. Some of these might be eligible for garbage
collection.
■ Total. The total number of objects that have been allocated since the application
began.
■ Total Size. The total amount of memory used by the objects.
■ Average Size. The average object size, calculated by dividing the live instances
into the total size.
Click on any column header to sort on that column.
You can search for a specific class name by choosing View > Find... from the
memory monitor window menu.
5.2.1 Saving and Loading Memory Monitor
Information
To save your memory monitor session, click on the Save button. Choose a file
name.
To load a memory monitor session, choose File > Utilities... from the KToolbar
menu. Click on Open Session in the Memory Monitor box. When you select a file,
the memory monitor window appears with all the session information.
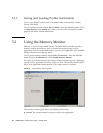
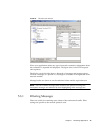
5.3 Using the Network Monitor
MIDP applications, at a minimum, are capable of HTTP network connections, but
many other types of network connections are also possible. The network monitor
provides a convenient way to see the information your application is sending and
receiving on the network. This is helpful if you are debugging network interactions
or looking for ways to optimize network traffic.
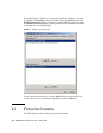
To turn on the network monitor, choose Edit > Preferences... from the KToolbar
menu. Click on the Monitor tab. Check Enable Network Monitoring.
Next time you run the emulator, the network monitor window pops up.