


42 J2ME Wireless Toolkit User’s Guide • October 2004
5.1.3 Saving and Loading Profiler Information
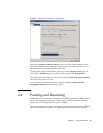
To save your profiler session, click on the Save button in the profiler window.
Choose a file name.
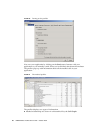
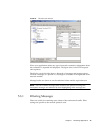
To load a profiler session, choose File > Utilities... from the KToolbar menu. Click
on Open Session in the Profiler box. When you select a file, the profiler window
appears with all the session information.
5.2 Using the Memory Monitor
Memory is scarce on many MIDP devices. The J2ME Wireless Toolkit includes a
memory monitor that makes it easy to examine the memory usage of your
application. You can see the total memory used by your application and a detailed
listing of the memory usage per object.
To turn on the memory monitor, choose Edit > Preferences... from the KToolbar
menu. Click on the Monitor tab. Check Enable Memory Monitor.
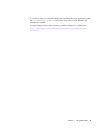
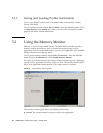
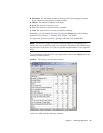
Next time you run the emulator, the memory monitor window pops up, displaying
a graph of your application’s memory usage over time. The memory monitor slows
down your application startup because every object created is recorded.
FIGURE 22 The memory monitor graph
The memory monitor graph shows the following information:
■ Current. The current amount of memory used by the application.