


Chapter 5 Monitoring Applications 41
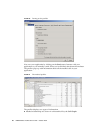
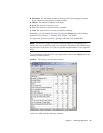
■ The right side of the profiler shows the execution time and number of calls for
each method and its descendants.
Note – The profiling values obtained from the emulator do not reflect actual
values on a real device.
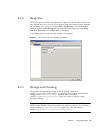
5.1.1 The Call Graph
The call graph shows a hierarchy of method calls. Methods that call other methods
are shown as folders. Double-click on a method to open it and see the methods it
calls. Methods that do not call any other method are shown as gray circles.
You can search for a particular class or method name. Click on Find... and fill in a
name. The search is performed from the current selection in the call graph to the
end. If you want to search the entire call graph, check Wrap before you click on the
Find button.
As you click on different nodes in the call graph, the right side of the profiler
shows details about the methods for that node.
5.1.2 Execution Time and Number of Calls
The right side of the profiler window displays detailed information about methods.
You can see the method name, the number of times it was called, and the amount
of time that the emualtor spent in the method. The execution time is described in
four distinct ways:
■ Cycles shows the amount of processor time spent in the method itself.
■ %Cycles is the percentage of the total execution time that is spent in the method
itself.
■ Cycles with Children is the amount of time spent in the method and its called
methods.
■ %Cycles with Children shows the time spent in the method and its called
methods as compared to the total execution time.
Click on any column to sort by that column. Click a second time to switch the sort
between ascending and descending.
The right pane shows the methods contained in the currently selected node in the
call graph. If you want to see every method, click on the <root> node in the call
graph.