


Display Screen
19
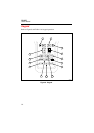
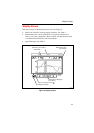
Display Screen
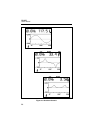
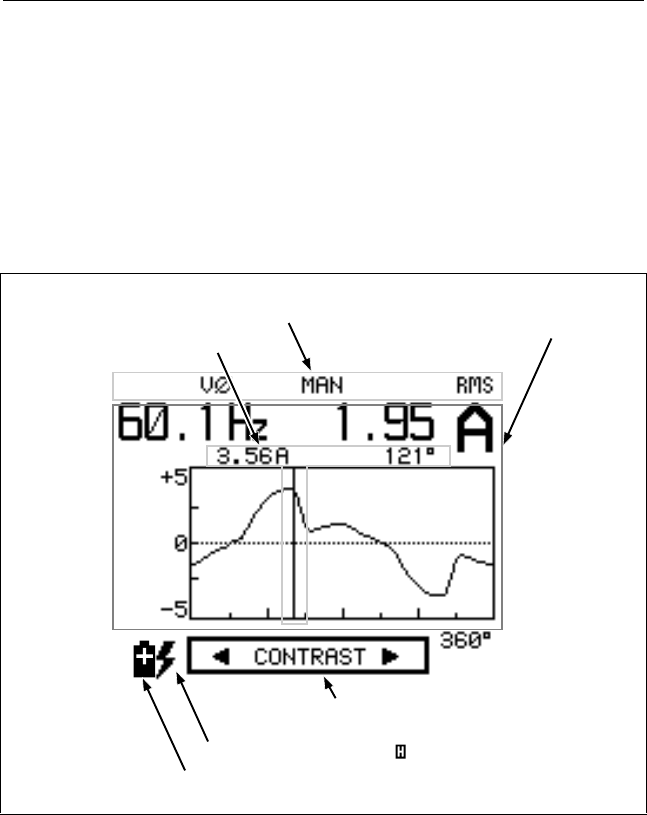
The screen consists of the following three areas (see Figure 9):
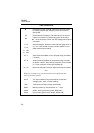
• Status Line: identifies Tester operating conditions. See Table 2.
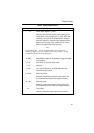
• Measurement Area: shows information as waveform, harmonics bar
chart, or set of text computations. Refer to Table 3 for abbreviations used
in all Measurement Functions and Screen Modes.
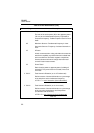
• Special Messages. See Table 4.
Cursor Data
Status Line (see Table 2)
Measurement Area
(see Table 3)
Low Battery Condition
>30V rms Input or in Hold ( )
Special Screen Messages
(see Table 4)
a9c.eps
Figure 9. Display Screen