


53
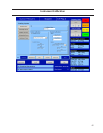
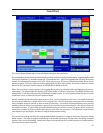
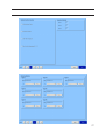
This screen allows the operator to view and adjust settings for the trend chart.
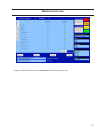
The trend analysis screen shows recorded data for problem analysis or tuning improvements. A logging buffer holds
30 minutes of data for 13 variables sampled at 10 second intervals. When the logging buffer fills with 30 minutes
of data, it is automatically transferred to a file, which will can up to 120 hours of accumulated data. When the file
has accumulated 120 hours of data, and the logging buffer has filled with another 30 minutes of data, the oldest
data in the file is dumped, and the newest 30 minute data is added to the file.
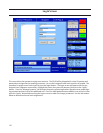
When the trend chart screen is opened, this logging data is copied to a display buffer and logging continues un-
interrupted. The data available for display in this display buffer is 120 hours maximum. The sample of data in the
display buffer is not altered by selection of a different variable to view. It is only discarded when the user exits the
trend chart screen, or when the control is powered down.
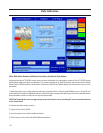
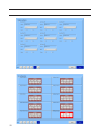
Up to 4 variables can be selected for plotting at one time. Each is assigned one of 4 colors - the plotted trace and
the vertical axis labels for a variable will be in its assigned color. You can move from viewing the plot to selecting
which variables and time interval to show as often as necessary. A start and stop button allows you to stop the
trending if desired. When the stop button is pressed, you are asked to provide a name for a file which will contain
the saved trend data. A Trace button and a Hold button allows you to move a cursor line across all four trend lines
and receive a readout of all four variables at the point in time of the cursor position. The hold button stops the data
from advancing on the display - but doesn’t stop the background trending.
The vertical axis scaling and offset for each variable plotted is based on its range of values over the entire display
buffer sample. This helps to magnify small changes in a variable and to keep one plot trace from falling on top of
another, but it can be misleading. Look at the range of the vertical axis for a variable and try to visualize how far
off screen the zero point would be.
Trend Chart