


22 of 50 Operating Information - 3650 Portable O2 Analyzer
Operator Manual
ORBISPHERE
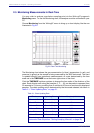
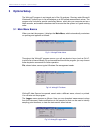
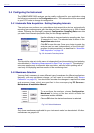
Click on the Continuous box, in the lower right corner, to enable or disable continuous
charting. When this box is checked, the chart scrolls continuously after reaching the 10
division, and the oldest samples are lost off the left of the chart. When Continuous is not
checked, the chart stops displaying new results after reaching the 10 division, and all
subsequent measurements are lost.
Click the up/down pointers for each measurement variable (GAS, TEMPERATURE and
PRESSURE) at the right of the chart to change the scaling of that value on the chart. The
display of each measurement variable may be turned on or off by choosing the
appropriate On or Off switch at the right of the chart.
If your measurements do not chart properly, try using a higher or lower value scale or
time base than the one displayed. Adjust these scale factors before starting the
monitoring operation.
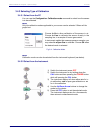
A running display of latest sample Gas, Temperature and Pressure is also shown in the
bottom-right corner of the chart.
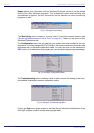
Use the buttons at the bottom of the chart to control real-time monitoring. Choose Go to
clear the chart and start real-time monitoring display, Stop to stop real-time monitoring
and Copy to copy the data from the chart as text information to the Windows Clipboard.
This information can be pasted from the clipboard into any Windows application, such as
a spreadsheet or word processor. See Table 2-1, “Chart Updating Rate,” on page 21 for
the maximum number of samples that can be copied for each chart time scale.
Finally, choose Close to close the Monitoring window.