


Viewing Chassis Information 2-3
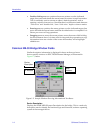
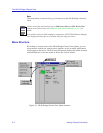
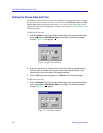
The NB-30 Bridge Chassis View
Front Panel Information
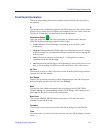
The areas surrounding the main port display area provide the following device
information:
IP
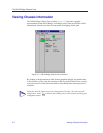
The Internet Protocol address assigned to the NB-30 appears in the title bar of the
Chassis View window; this will display the IP address you have used to create the
NB-30 icon. IP addresses are assigned via Local Management.
Connection Status
This color-coded area indicates the current state of communication between
SPECTRUM Element Manager and the NB-30 bridge.
¥ Green indicates the NB-30 bridge is responding to device polls (valid
connection).
¥ Magenta indicates that the NB-30 bridge is reconÞguring because of a change
in the Spanning Tree; note that board and port menus are inactive during this
stand-by state.
¥ Blue indicates an unknown contact status Ñ polling has not yet been
established with the NB-30 bridge.
¥ Red indicates the NB-30 bridge is not responding to device polls (device is off
line, or device polling has failed across the network for some other reason).
Up Time
The amount of time, in a day(s) hh:mm:ss format, that the NB-30 bridge has been
running since the last start-up.
Port Status
Displays the port status currently in effect. Management for the NB-30 supports
one port display, therefore this Þeld will state Default.
MAC
The physical layer address assigned to the port through which SPECTRUM
Element Manager is communicating with the NB-30 bridge. MAC addresses are
hard-coded in the device, and are not conÞgurable.
Boot Prom
The revision of BOOT PROM installed in the device. This Þeld will not be
available for the NB-30 bridge.
Firmware
The revision of device Þrmware stored in the NB-30 bridgeÕs FLASH PROMs.
Time
The current time, in a 24-hour hh:mm:ss format, set in the NB-30 bridgeÕs internal
clock.