


Bridge Statistics 3-9
NB-30 Bridging
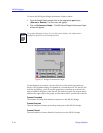
You can also disable bridging across all ports or on your NB-30 from the Chassis
View window. To disable bridging at the device level from the Chassis View
window:
1. Click on the Board Index (1) in the front panel display. A menu will appear.
2. Click on Enable Bridge to restart bridging at the device level, or Disable
Bridge to halt bridging across the entire device.
Bridge Statistics
The following sections describe the Statistics windows that are available for the
NB-30 bridge that is being monitored via SPECTRUM Element Manager, both at
the device and port levels.
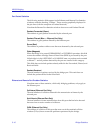
Performance Graphs
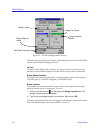
You use Bridge Performance Graphs to view a color-coded strip chart that shows
you the trafÞc being bridged through all networks or an individual network
supported by your device. You can conÞgure the display to show frames Þltered,
forwarded, or transmitted across the device or its individual bridging interfaces,
as well as the number of errors experienced at both levels. The graph has an X axis
that indicates the 60-second interval over which charting occurs continuously,
while its Y axis measures the number of packets or errors that are processed by
the device or its bridging interfaces.
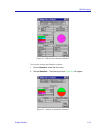
You can select the type of errors you wish to monitor by using the available menu
buttons. When you click on the error type you wish to view, the name of that error
will appear in the button, and the Performance Graph will refresh. The graph will
now generate a strip chart based on the newly deÞned parameters.
At the device level, a Detail button on the window allows you to compare the
packets forwarded, Þltered, or transmitted on all networks supported by the
device, as well as errors on all networks.
For a selected bridged network, the Detail button allows you to view the number
of packets forwarded to, or received from, each other network supported by the
device.
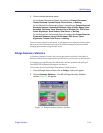
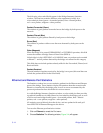
To access the device-level Bridge Performance Graph window:
1. From the Bridge Status window, click on Bridge. A menu will appear.
2. Click on Performance Graph.... The NB-30 Bridge Performance Graph
window, Figure 3-2, will appear.