


NB-30 Bridging
3-14 Bridge Statistics
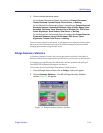
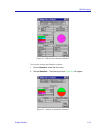
The following color-coded Þelds appear in the Bridge Summary Statistics
window. The Þrst four statistics Þelds are also represented visually by a
color-coded pie chart (green = forwarded packets, blue = Þltered packets,
red = error packets, magenta = other packets).
Packets Forwarded (Green)
The number of good packets forwarded across the bridge by both ports on the
network.
Packets Filtered (Blue)
The number of good packets Þltered by both ports on the bridge.
Errors (Red)
The number of packets with an error that were detected by both ports on the
bridge.
Other (Magenta)
When the bridge is in normal FORWARDING or FILTERING operation, this Þeld
counts the number of Bridge Protocol Data Units (BPDUs).
If the bridge is in the LISTENING or LEARNING state, no packets are forwarded
or Þltered Ñ and all packets detected by the bridge are counted in this category.
This Þeld does not include packets already tallied in the Forwarded, Filtered, and
Received Þelds.
Packets Received
The total number of packets received by the bridgeÕs two ports (this total does not
include the packets tallied in the Other Þeld).
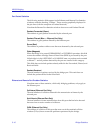
Ethernet and Remote Port Statistics
The Statistics window lets you see statistics gathered at the Ethernet and Remote
ports of the bridge. These statistics display information about the normal trafÞc
Þltered or forwarded by the bridge ports, as well as errors encountered by the
ports and packets that were discarded for various reasons.
As with the Bridge Summary Statistics window, a color-coded pie chart provides
a graphical breakdown of trafÞc Þltered or forwarded by the bridge ports, as well
as errors and non-bridged trafÞc (green = forwarded packets, blue = Þltered
packets, red = error packets, magenta = other packets).
All statistics are read directly from the device, and are updated with each poll
from SPECTRUM Element Manager to the device.
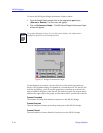
To access the Ethernet port Statistics window:
1. Click on Ethernet to reveal the Port menu.
2. Choose Statistics. The following window, Figure 3-4, will appear.