


Bridge Statistics 3-13
NB-30 Bridging
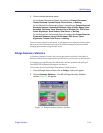
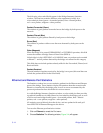
2. Click on the desired frames mode:
For the Bridge Performance Graph, the options are Frames Forwarded,
Frames Received, Frames Filtered, Device Errors, or Nothing.
For the Ethernet Port Performance Graph, the options are Frames Received,
Discarded Inbound, Forwarded Outbound, Lack of Buffer Space, Trans.
Exceeded, Collisions, Trans. Aborted, Out of Window Coll., CRC Errors,
Frame Alignments, Giant Packets, Total Errors, or Nothing.
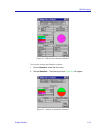
For the Remote Port Performance Graph, the options are Frames Received,
Forwarded Outbound, Lack of Buffer Space, CRC Errors, Frame
Alignments, Timeout, Total Errors, or Nothing.
Once you have selected a new mode, it will appear in its respective button. After
the next poll, the Performance Graph will refresh and begin to measure NB-30
bridging performance using the new mode.
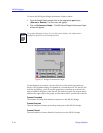
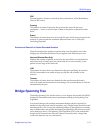
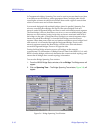
Bridge Summary Statistics
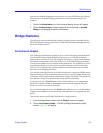
A Summary Statistics window lets you see the packets received, forwarded, or
Þltered on all networks supported by the NB-30, as well as errors on all networks.
All statistics are read directly from the device, and are updated with each poll
from SPECTRUM Element Manager to the device.
To access the device-level Bridge Performance Graph window:
1. From the Bridge Status window, click on Bridge. A menu will appear.
2. Click on Summary Statistics.... The NB-30 Bridge Summary Statistics
window, Figure 3-3, will appear.
Figure 3-3. Bridge Summary Statistics Window