


NB-30 Bridging
3-10 Bridge Statistics
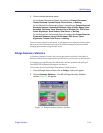
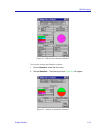
To access the NB-30 port Bridge Performance Graph window:
1. From the Bridge Status window, click on the appropriate port button
(Ethernet or Remote). The Port menu will appear.
2. Click on Performance Graph.... The NB-30 port Bridge Performance Graph
window will appear.
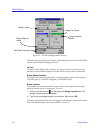
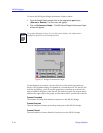
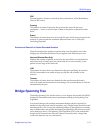
Figure 3-2. Bridge Performance Graph
For the Bridge level window, you can select two of the following statistics to
display. The graphical display will update at 2 second intervals. For the Þrst 120
seconds of graphing, you will note the graph lines extending as each intervalÕs
data is added to the graph. After the Þrst 120 seconds expires, the newest data is
added at the right edge of the graph, and the oldest data is scrolled off to the left.
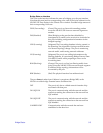
Frames Forwarded
The number of frames forwarded by both ports on the NB-30Õs bridge.
Frames Received
The total number of frames received by both ports on the NB-30Õs bridge.
Frames Filtered
The total number of frames Þltered by both ports on the NB-30Õs bridge.
NOTE
The graphic displayed in Figure 3-2 is a device-level window; the window that is
displayed at the port level is virtually identical.