


Performance Tests
TDS 500D, TDS 600B & TDS 700D Performance Verification and Specifications
1–43
2. Confirm all four channels are within limits for channel delay:
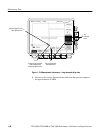
a. Set up the generator: Set the generator frequency to 250 MHz and the
amplitude for about six divisions in CH 1.
Hint: As you are adjusting the generator amplitude, push SET LEVEL
TO 50% frequently to speed up the updating of the waveform amplitude
on screen.
b. The horizontal SCALE should already be set to 500 ps. On the
TDS 580D, TDS 784D, TDS 794D, and 600B, now set it to 200 ps. On
the TDS 520D, 540D, 724D, and 754D, push the front-panel ZOOM
button, press the side-menu On button, set the horizontal SCALE to
250 ps, and be sure the vertical scale factor is kept at 1.0X and the
horizontal scale factor is 2.0X.
c. Save a CH 2 waveform: Press CH 2. Be sure the vertical scale factor is
kept at 1.0X. Then press save/recall WAVEFORM. Now, press the
main-menu button Save Wfm; then press the side-menu button
To Ref 2.
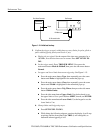
d. Save CH 3 (AX1 on some TDS models) waveform:
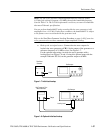
H Move the coupler from CH 2 to CH 3 (AUX1 on some TDS
models), so that CH 1 and CH 3 are driven. Press WAVEFORM
OFF. Press CH 3. Be sure the vertical scale factor is kept at 1.0X.
Then press the side-menu button To Ref 3.
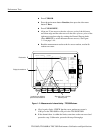
e. Display all test signals:
H Press WAVEFORM OFF to remove CH 3 (AX1 on some TDS
models) from the display.
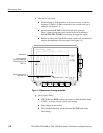
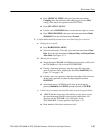
H Display the live waveform. Move the coupler from CH 3 to CH 4,
so that CH 1 and CH 4 are driven. (Use AUX1 and AUX2 instead of
CH3 and CH4 if your TDS model is so equipped). Press CH 4 to
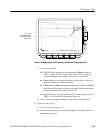
display. Be sure the vertical scale factor is kept at 1.0X. See Figure
1–11 on page 1–44.
H Display the reference waveforms. To do this, press the front-panel
button MORE. Press the main-menu buttons Ref 2 and Ref 3. You
may notice their overlapping ground reference indicators. See
Figure 1–11 on page 1–44.
f. Measure the test signal:
H Locate the time reference points for these waveforms. Do this by
first identifying the point where the rising edge of the left-most
waveform crosses the center horizontal graticule line. Next, note the
corresponding time reference point for the right-most waveform. See
Figure 1–11 on page 1–44.