Appendix A: Characteristics
TSG 601 User Manual
37
Waveform Diagrams
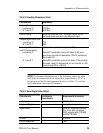
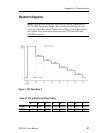
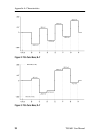
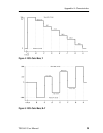
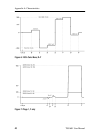
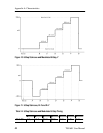
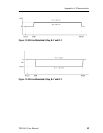
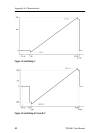
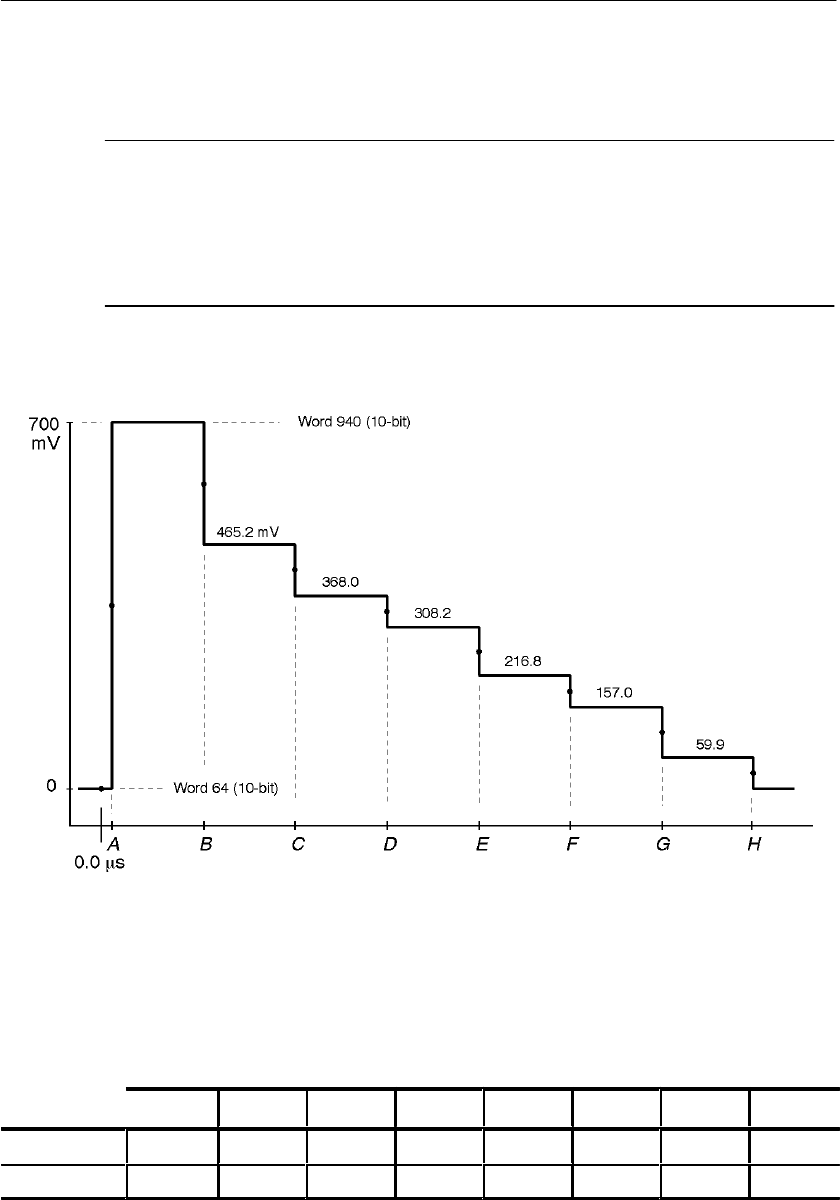
NOTE. The following diagrams represent the analog equivalents of
the TSG 601 digital test signals. Horizontal axis units are microse-
conds (ms) after the start of Digital Active Video. Unless specified in
the caption, each illustration represents both 525 line/60 Hz and
625/50 Hz signals.
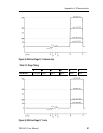
Figure 1: 75% Color Bars, Y
Table 12: 75% and 100% Color Bars Timing
A B C D E F G H
625/50 0.74 µs 7.26 13.70 20.22 26.74 33.18 39.70 46.15
525/60 0.37 µs 6.96 13.56 20.07 26.67 33.26 39.85 46.37


