


USING THE COMBISCOPE INSTRUMENTS 3 - 49
Scaling can be adjusted with the "CURSORS TRACK and delta" knobs via the
MATHPLUS - PARAM menu option.
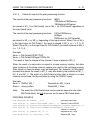
PROGRAM EXAMPLE:
CALL Send(0, 8, "CALCulate:INTegral:STATe ON", 1) ’
Integral CALC1 on
CALL Send(0, 8, "CALCulate2:DERivative:POINts 35", 1)’
35 differential points
CALL Send(0, 8, "CALCulate2:DERivative:STATe ON", 1) ’
Differential CALC2 on
3.9.4 Frequency domain transformations
The result of an FFT (Fast Fourier Transformation) calculation is displayed as a
trace of amplitude values (vertically) versus frequency values (horizontally). The
vertical result can be expressed as a relative or an absolute amplitude value. The
CALCulate:TRANsform:FREQuency:TYPE command selects between the
RELative and ABSolute result. The DISPlay:WINDow:TEXT<n>:DATA? query
allows you to read the calculated amplitude and frequency value.
RELATIVE FFT:
A relative FFT calculation consists of a frequency (Hz) and an amplitude in
(dB), relative to the frequency component with the largest amplitude.
ABSOLUTE FFT:
An absolute FFT calculation consists of a frequency (Hz) and an amplitude in
dBm (dB with respect to 1 milliwatt), dBµV (dB with respect to 1 microvolt), or
Vrms (Volt RMS) as selected via the front panel CURSORS - READOUT
softkey menu.
The following FFT window functions can be selected using the
CALCulate:TRANsform:FREQuency:WINDow command:
•
The FFT RECTangular function transforms a repetitive time amplitude trace
into its power spectrum.
•
The FFT HAMMing and HANNing functions reduce the side lobes by applying
a Hamming respectively Hanning window to the input signal. This improves
the visibility of the minor frequency components if the limited area is not
accurately selected.
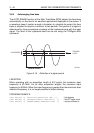
The resulting FFT trace is a MIN/MAX (envelope) trace, which means that each
trace point is determined twice (one for the MINimum envelope and one for the
MAXimum envelope). The FFT trace points are scaled between +4 and -4
divisions on the screen. So, the samples values that are returned as response to
a TRACe? query are shifted 4 divisions upwards. The values of the resulting FFT
trace points are between -0 dB and -80 dB. This results in the following relation
between screen position and sample value: