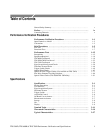
Table of Contents
ii
TDS 500D, TDS 600B & TDS 700D Performance Verification and Specifications
List of Figures
Figure 1–1: Map of display functions 1–3. . . . . . . . . . . . . . . . . . . . . . . . . .
Figure 1–2: Verifying adjustments and signal-path compensation 1–6. .
Figure 1–3: Universal test hookup for functional tests –
TDS 600B shown 1–8. . . . . . . . . . . . . . . . . . . . . . . . . . . . . . . . . . . . . . . .
Figure 1–4: Measurement of DC offset accuracy at zero setting 1–31. . . .
Figure 1–5: Initial test hookup 1–32. . . . . . . . . . . . . . . . . . . . . . . . . . . . . . . .
Figure 1–6: Measurement of DC accuracy at maximum
offset and position 1–35. . . . . . . . . . . . . . . . . . . . . . . . . . . . . . . . . . . . . . .
Figure 1–7: Initial test hookup 1–37. . . . . . . . . . . . . . . . . . . . . . . . . . . . . . . .
Figure 1–8: Optional initial test hookup 1–37. . . . . . . . . . . . . . . . . . . . . . . .
Figure 1–9: Measurement of analog bandwidth 1–40. . . . . . . . . . . . . . . . . .
Figure 1–10: Initial test hookup 1–42. . . . . . . . . . . . . . . . . . . . . . . . . . . . . . .
Figure 1–11: Measurement of channel delay – TDS 684B shown 1–44. . . .
Figure 1–12: Initial test hookup 1–46. . . . . . . . . . . . . . . . . . . . . . . . . . . . . . .
Figure 1–13: Measurement of accuracy – Long-term and delay time 1–48
Figure 1–14: Initial test hookup 1–50. . . . . . . . . . . . . . . . . . . . . . . . . . . . . . .
Figure 1–15: Measurement of time accuracy for pulse and
glitch triggering 1–51. . . . . . . . . . . . . . . . . . . . . . . . . . . . . . . . . . . . . . . . .
Figure 1–16: Initial test hookup 1–53. . . . . . . . . . . . . . . . . . . . . . . . . . . . . . .
Figure 1–17: Measurement of trigger-level accuracy 1–55. . . . . . . . . . . . .
Figure 1–18: Initial test hookup 1–58. . . . . . . . . . . . . . . . . . . . . . . . . . . . . . .
Figure 1–19: Measurement of trigger sensitivity – 50 MHz results
shown on a TDS 684B screen 1–59. . . . . . . . . . . . . . . . . . . . . . . . . . . . . .
Figure 1–20: Initial test hookup 1–62. . . . . . . . . . . . . . . . . . . . . . . . . . . . . . .
Figure 1–21: Measurement of main trigger out limits 1–64. . . . . . . . . . . . .
Figure 1–22: Initial test hookup 1–66. . . . . . . . . . . . . . . . . . . . . . . . . . . . . . .
Figure 1–23: Measurement of probe compensator frequency 1–68. . . . . . .
Figure 1–24: Subsequent test hookup 1–69. . . . . . . . . . . . . . . . . . . . . . . . . .
Figure 1–25: Measurement of probe compensator amplitude 1–70. . . . . .
Figure 1–26: Jitter test hookup 1–72. . . . . . . . . . . . . . . . . . . . . . . . . . . . . . .
Figure 1–27: Jitter test displayed waveform – TDS 684B shown 1–73. . . .
Figure 1–28: Jitter test when completed – TDS 684B shown 1–74. . . . . . .
Figure 1–29: Triggered signal range test – 300 mV 1–75. . . . . . . . . . . . . . .
Figure 1–30: Triggered signal range test – 75 mV 1–76. . . . . . . . . . . . . . . .
Figure 1–31: 60 Hz Rejection test hookup 1–77. . . . . . . . . . . . . . . . . . . . . .
Figure 1–32: 60 Hz Rejection test setup signal 1–77. . . . . . . . . . . . . . . . . . .


