


PicoScope 6 User Guide
7
Copyright 2006 Pico Technology Limited. All rights reserved.PSW044-2.0
5
PicoScope and oscilloscope primer
This chapter explains the fundamental concepts that you will need to know before
working with the PicoScope software. If you have used an oscilloscope before, then
most of these ideas will be familiar to you. If not, please take a few minutes to read at
least the "Oscilloscope basics " and "PicoScope basics " topics, and then return
here to read the more detailed topics in this chapter when you need them.
5.1
Oscilloscope basics
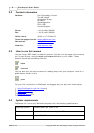
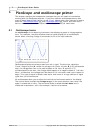
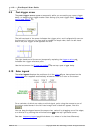
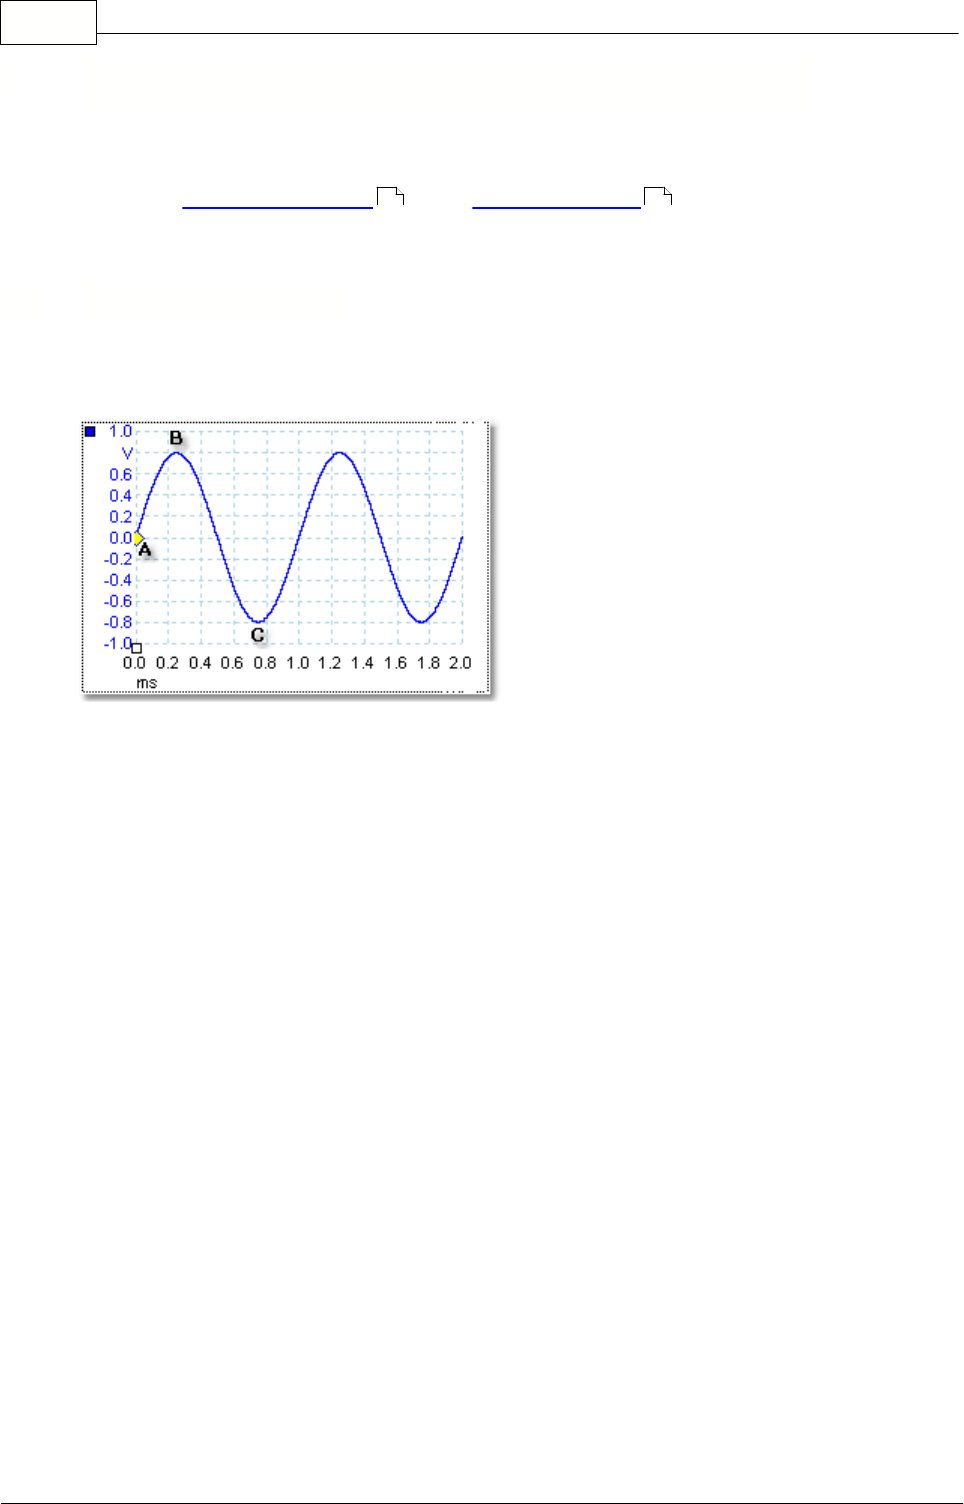
An oscilloscope is a measuring instrument that displays a graph of voltage against
time. For example, the picture below shows a typical display on an oscilloscope
screen when a varying voltage is connected to one of its input channels.
Oscilloscope displays are always read from left to right. The blue line, called the
"trace", begins at point A, where the voltage is 0.0 volts. At point B, 0.25 milliseconds
later, the voltage has risen to its positive peak of 0.8 volts. At point C, 0.75
milliseconds after the start, the voltage has dropped to its negative peak of -0.8 volts.
After 1 millisecond, the voltage has risen back to 0.0 volts and a new cycle is about to
begin. This type of signal is called a sine wave, and is one of a huge number of signal
types that you will encounter.
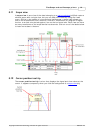
All oscilloscopes allow you to adjust the vertical and horizontal scales of the display.
The vertical scale is called the voltage range (in the most common case, when the
signal is measured in volts). The horizontal scale is called the time base and is
measured in seconds or, as in this example, fractions of a second.
7 8