Measuring Spread Spectrum and Multitone Signals
22
Measuring Spread Spectrum and Multitone Signals
To achieve high data transfer rates within a given bandwidth, many
transmission schemes are based around phase and amplitude (I and Q)
modulation. These include CDMA, W-CDMA and digital television. These
signals are characterized by their appearance on a spectrum analyzer display
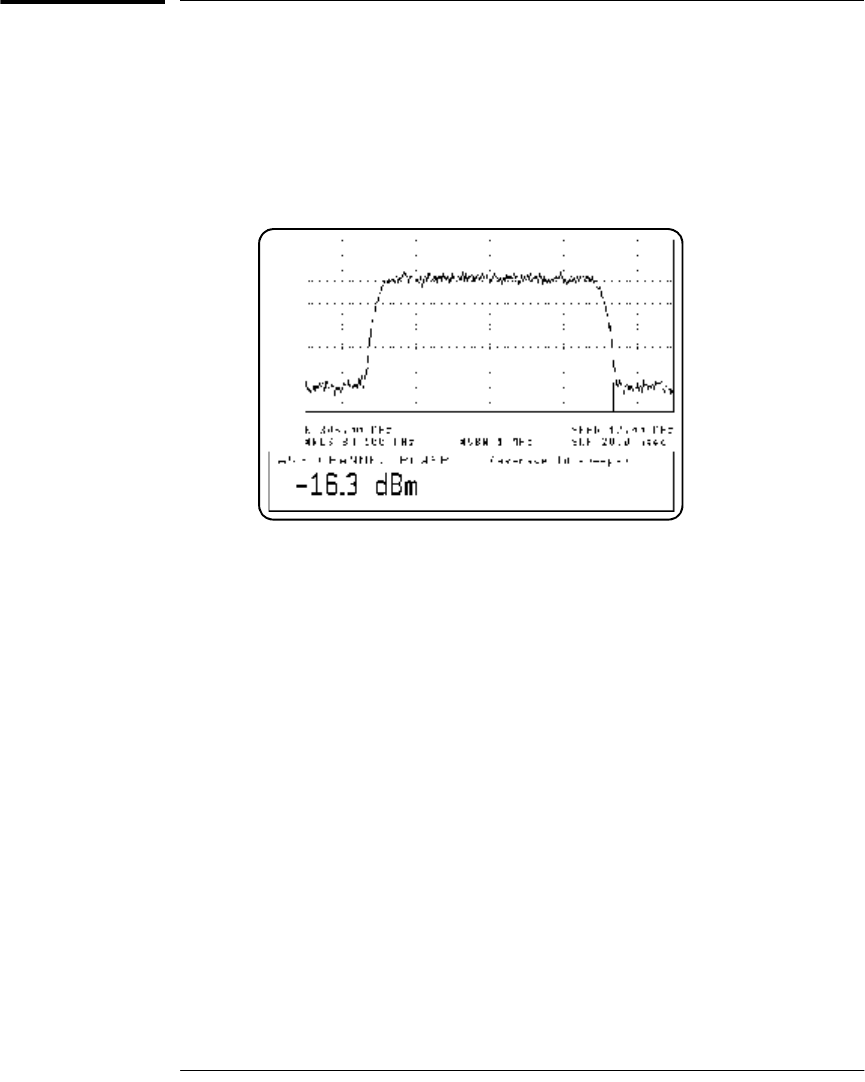
— a high amplitude noise-like signal of bandwidths up to 20 MHz. An 8 MHz
bandwidth digital television signal is shown in Figure 5.
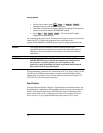
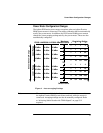
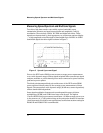
Figure 5 Spread Spectrum Signal
Prior to the HP E-series E9300 power sensors, average power measurement
over a wide dynamic range of these signals required either tuned/swept signal
analyzer methods or a dual channel power meter connected to power sensors,
pads and a power splitter.
The diode pair/attenuator/diode pair architecture of the HP E-series E9300
power sensors is ideally suited to the average power measurement of these
signals. The sensors have wide dynamic range (80 dB max, sensor dependent)
and are bandwidth independent.
Some signal modulation formats such as orthogonal-frequency-division
multiplexing (OFDM) and CDMA have large crest factors. The Agilent
E-series E9300/1/4A power sensors can measure +20 dBm average power even
in the presence of +13 dB peaks as long as the peak pulse duration is less than
10 microseconds. For high power applications, such as base-station testing the
E9300/1B and E9300/1H are recommended.


