


E9300/1/4/A Power Sensor Specifications
41
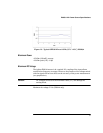
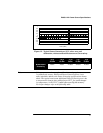
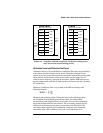
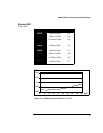
Figure 14 Autofilter, default resolution, 10 dB decreasing power
step (not across the switching point)
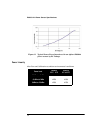
Calibration Factor and Reflection Coefficient
Calibration Factor (CF) and Reflection Coefficient (Rho) data are provided on
a data sheet included with the power sensor. This data is unique to each
sensor. If you have more than one sensor, match the serial number on the data
sheet with the serial number on the power sensor you are using. The CF
corrects for the frequency response of the sensor. Agilent EPM series power
meters automatically read the CF data stored in the sensor and use it to make
the corrections.
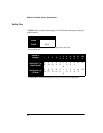
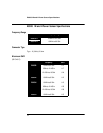
Reflection Coefficient (Rho, or ρ) relates to the SWR according to the
following formula:
Maximum uncertainties of the CF data are listed in the following tables.
As the Agilent E-series E9300 power sensors have two independent
measurement paths (high and low power paths), there are two calibration
factor uncertainty tables for each sensor. The uncertainty analysis for the
calibration of the sensors was done in accordance with ISO Guide. The
uncertainty data reported on the calibration certificate is the expanded
uncertainty with a 95% confidence level and a coverage factor of 2.
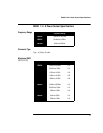
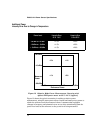
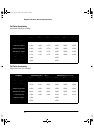
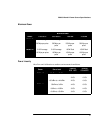
Normal Mode
Maximum Sensor Power
-50 dBm
Sensor
Dynamic
Range
+10 dBm
+2 dBm
-40 dBm
70 ms
210 ms
400 ms
Minimum Sensor Power
Typical
Settling
Times
1 s
70 ms
120 ms
1 s
6.5 s
13 s
-4 dBm
-10 dBm
-20 dBm
-30 dBm
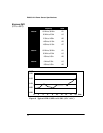
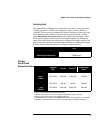
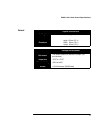
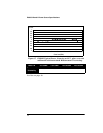
X2 Mode
Maximum Sensor Power
-50 dBm
Sensor
Dynamic
Range
+10 dBm
+2 dBm
-40 dBm
40 ms
120 ms
210 ms
Minimum Sensor Power
Typical
Settling
Times
400 ms
40 ms
70 ms
400 ms
3.4 s
6.8 s
-4 dBm
-10 dBm
-20 dBm
-30 dBm
SWR
1 ρ+
1 ρ–
-------------=