


E9300/1B and H Power Sensor Specifications
55
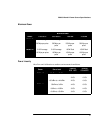
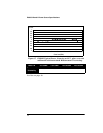
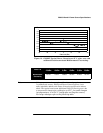
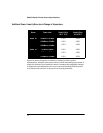
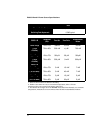
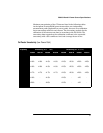
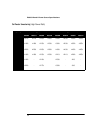
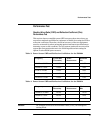
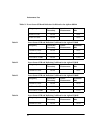
Maximum uncertainties of the CF data are listed in the following tables.
As the Agilent E-series E9300 power sensors have two independent
measurement paths (high and low power paths), there are two calibration
factor uncertainty tables for each sensor. The uncertainty analysis for the
calibration of the sensors was done in accordance with ISO Guide. The
uncertainty data reported on the calibration certificate is the expanded
uncertainty with a 95% confidence level and coverage factor of two.
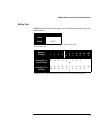
Cal Factor Uncertainty (Low Power Path)
Frequency Uncertainty (25°C±±10°C) Uncertainty (0°C to 55°C)
E9300B E9301B E9300H E9301H E9300B E9301B E9300H E9301H
10 MHz to
30 MHz
±1.8% ±1.8% ±1.8% ±1.8% ±2.2% ±2.2% ±2.2% ±2.2%
30 MHz to
500 MHz
±1.6% ±1.6% ±1.6% ±1.6% ±2.0% ±2.0% ±2.0% ±2.0%
500 MHz to
1.2 GHz
±1.8% ±1.8% ±1.8% ±1.8% ±2.5% ±2.5% ±2.5% ±2.5%
1.2 GHz to
6GHz
±1.7% ±1.7% ±1.7% ±1.7% ±2.0% ±2.0% ±2.0% ±2.0%
6 GHz to
14 GHz
±1.8% - ±1.8% ±2.0% - ±2.0 -
14 GHz to
18 GHz
±2.0% - ±2.0% ±2.2% - ±2.2 -