Using the TRMMIM Hub View
2-12 Monitoring Hub Performance
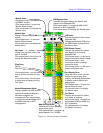
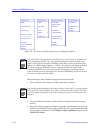
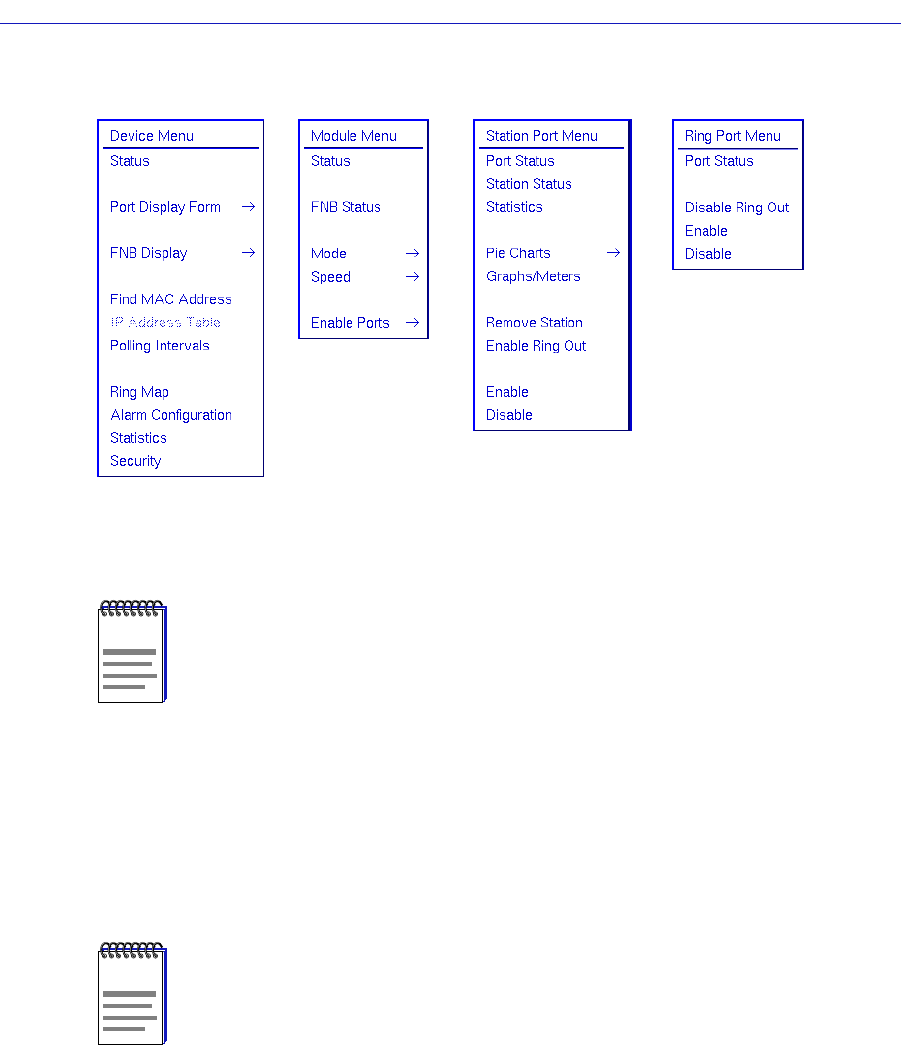
Figure 2-5. The Device, Module, Station Port, and Ring Port Menus
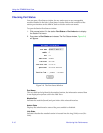
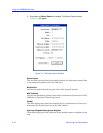
Hub performance data available through these menus includes:
• Device, Module, Port, Station, and Ring Port Status windows.
• Device and Station statistics, which provide a complete breakdown of ring
activity.
• Device pie-charts, graphs, and meters, as graphic representations of the types
and levels of traffic passing through the hub. (For more information about pie
charts, graphs, and meters, see the Charts, Graphs, and Meters chapter in the
SPMA Tools Guide.)
NOTE
Note that the Hub View application only allows you to control boards in the domain of a
single management module. If you have another management module installed in the
chassis to the left of the monitored TRMMIM, boards that are under the domain of that
module (i.e., Media Interface Modules – or MIMs – to its left) will still display in the Hub
View of the monitored TRMMIM; however, only boards within the domain of the
monitored TRMMIM can be correctly controlled. Although you can display Module
menus for MIMs outside of the domain of the monitored TRMMIM, you cannot use these
menus to correctly control those MIMs.
NOTE
Note that information displayed in the Status windows is static; that is, it is only gathered
at the instant the Device, Module, Port, Station, or Ring Port Status window is opened.
To receive updated information in one of these windows, you must exit the window and
re-open it.


