


Monitoring Ring and Station Statistics 5-5
Statistics
If you are running SPMA in conjunction with HP Network Node Manager or IBM
NetView you can also customize ring-specific or station-specific graphs using the
same variables as are available for the meters. You can graph up to 25 variables in
a single graph.
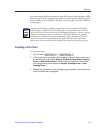
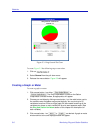
Creating a Pie Chart
To create a pie chart:
1. Click on either or .
2. A Pie Charts menu will appear. When creating a Ring Pie Chart select one of
the following menu selections: General, Protocols, Frame Sizes, Isolating
Errors, or Non-Isolating Errors. When creating a Station Pie Chart select
one of the following menu selections: General, Isolating Errors, or Non-
Isolating Errors.
3. Release the mouse button while highlighting your selection. A pie chart similar
to the one below will be displayed.
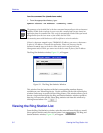
NOTE
Graphing capabilities are provided by an application that is included in HP Network
Node Manager and IBM NetView; therefore, graphs are only available when SPMA is
run in conjunction with one of these network management platforms. If you are running
SPMA in a stand-alone mode or in conjunction with SunNet Manager, no graphing
capabilities are available and no graph-related options will be displayed on buttons or
menus. Note that the screens displayed in this guide will include the graph-related
options where they are available; please disregard these references if they do not apply.