


Statistics
5-6 Monitoring Ring and Station Statistics
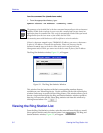
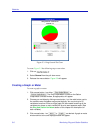
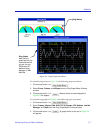
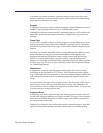
Figure 5-3. Ring General Pie Chart
To create Figure 5-3 the following steps were taken:
1. Click on .
2. Select General from the pull down menu.
3. Release the mouse button. Figure 5-3 will appear.
Creating a Graph or Meter
To create a graph or meter:
1. Click mouse button 1 on either or
. The Ring Graph/Meter Choices or the Station
Graph/Meter Choices window, as appropriate, will appear.
2. Choose your variables by clicking mouse button 1 on the radio button next to
the variable name. Variables are grouped logically. You can pick up to 25
variables at one time. Either a single graph will be created containing all the
variables you chose, or each variable will form its own separate meter. (See
the Ring and Station Variables section of this chapter for descriptions of
each variable.)
3. Click mouse button 1 on or , as desired. A graph or meter
window similar to the one displayed below will appear.