


Installation and Configuration Manual 55
Performance Optimization
Principles of Operation Certified System DrawingsReturn PolicyPerformance Optimization
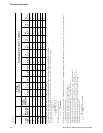
Table A-2
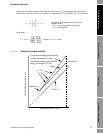
At base
conditions At sample gas conditions of °C and bars
1 Gas
type
2
Molecular
mass M
(1)
(1) Column 2 data derived from page x.x or other suitable tables.
3 γ at
sample
conditions
(2)
(2) Column 3 data is interpolated from International Standard Gas Tables (for example, IUPAC) at SAMPLE GAS conditions.
4 Z
s
(3)
(3) Column 4 data is interpolated from International Standard Gas Tables (for example, IUPAC) at BASE GAS conditions.
5
ρ
s
true
(4)
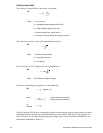
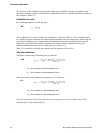
(4) Column 5 data calculated using:
6 V
F
(5)
(5) Column 6 data calculated using:
7 Z
(6)
(6) Column 7 data calculated using Z = 1–0.000238P for Nitrogen; Z = 1+P(0.00017+6E–05M x 1.13E–05M
2
+7.2E–03 x I) for CH
4
, where P is pressure in bars absolute and I is
volume/mole fraction of inert gases.
8 Z
F
(7)
(7) Column 8 data calculated using Z
F
= Column 7/Column 4.
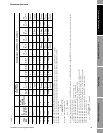
9 E
F
(8)
(8) Column 9 data calculated usig E
F
= Column 6 x Column 8.
10
Δ
F
%
(9)
(9) Column 10 data calculated using Δ
F
% = (1–Column 9) x 100%.
11
E
1
(10)
(10)Column 11 data is E
1
= x or y, or calculated for E
1a
, E
1b
, or E
1c
(see A10 on page 52).
12
Δ
1
%
(11)
(11)Column 12 data calculated using Δ
1
% = (Column 11–Column 9) x 100%.
13
E
2
(12)
(12)Column 13 data is E
2
= x or c, or calculated for E
2a
, E
2b
, or E
2c
(see A11 on page 52).
14
Δ
2
%
(13)
(13)Column 14 data calculated using Δ
2
% = (Column 13–Column 9) x 100%
15
ρ
s
ind.
(14)
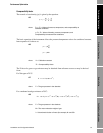
(14)Column 15 data calculated using:
Cal 16.04 1.32 0.9977 X
0.7171
0.9916 0.987
6
0.9899 x 0.9816 0 x 0.9816 0 x 0.9816 0 X
0.7171
Cal 28.01 1.41 0.9995 Y
1.2500
0.9862 0.998
3
0.9988 y 0.9850 0 y 0.9850 0 E
2y
0.9712
–1.38 Y’
1.2328
Sample 16.96 1.32 0.9976 A
0.7583
0.9911 0.987
1
0.9895 a 0.9807 0.13 E
1a
0.9820
0.13 E
2a
0.9803
–0.04 A’
0.7580
Sample 17.32 1.32 0.9977 B
0.7743
0.9909 0.987
3
0.9896 b 0.9806 0.16 E
1b
0.9822
0.16 E
2b
0.9798
–0.08 B’
0.7737
Sample 19.28 1.30 0.9972 C
0.8624
0.9897 0.984
9
0.9877 c 0.9775 2.25 E
1c
0.9829
0.54 0.9775 0 C’
0.8624
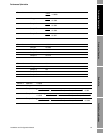
ρ
s
P
s
M
0.0831434 T
s
× Z
s
×
-----------------------------------------------------=
V
F
1
M
γ
-----
0.000695×–=
ρ
s
ind
100 Column14+
100
----------------------------------------------
Column5×=