


Page 12
Page 13
Page 12
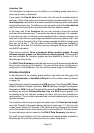
5. Intraday Graph Window
To view the intraday graph window if it is not already showing on your screen,
select Window : New Window : Intraday graph.
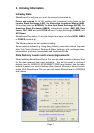
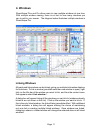
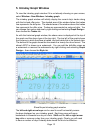
The intraday graph window will initially display the current day’s trades along
with the bid and offer price. The shaded area of the window below the trades
line represents the bid price. The shaded area of the window above the trades
line represents the offer price. Trades are represented as coloured dots. You
can change their colour and size by right clicking and selecting Graph Design...
then choose the Trades tab.
As with the historical graph window, the share name is displayed at the top of
the graph and the share type at the top right. The top left of the graph shows
the currency in which the share is traded, and just below this is the current date.
The bottom of the graph shows the time scale in a twenty-four hour format. The
share’s EPIC is shown as a watermark. You can add the bid/offer prices as
a watermark or remove the watermarks by right clicking and selecting Graph
Design... then choose the Style tab.
ShareScope Intraday graph window
The left and right arrow keys can be used to scroll horizontally across
the days displayed on your intraday graph. Each key press will move
backwards or forwards one day at a time. Shift and the left or right arrow
key adds or removes a day from your intraday graph. Clearly you will need
to have a number of days’ intraday data stored for this to be effective.