


Page 16
Page 16
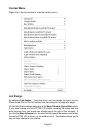
Show opening price will display the day’s opening price on the left-hand vertical
axis of the graph.
Previous day’s high/low/close will overlay the previous day’s high, low or
closing price as a horizontal line on each day of the intraday chart. ShareScope
will get prices from the historical price database. If this is not available (e.g.
the historical data has not been updated or is not available for that share), then
your intraday data will be used as a source instead. If the necessary data is
not available from either source, the line will not be shown.
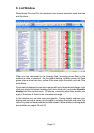
Trades Tab
Trades can be displayed as either a Line or Dots. If you do not want to display
trades select None. If the Buy/Sell option has been selected then there are two
lines, one for imputed buys and one for imputed sells; unknowns are reported
as dots.
Use the dot options to vary the dot size and colour. You can also tick the Show
size option so that the size of each trade dot will correspond to the volume of
that specific trade.
The Volume Histogram can be displayed in two ways:
Trade based, which will add a volume figure for each individual trade as it
happens.
Period based, where the volume will be broken down into the Fixed period
lengths selected on the Time tab (see below). If you do not wish to see volume
select None.
If you have selected Period based volume, a signal line can be added to the
volume display. This will add a moving average to the volume histogram based
on the number of periods you enter in the periods box. You can choose which
type of moving average is used and you can change the colour and style of the
line. By default, the volume bars are coloured black whether they are greater
or lower than the previous traded volume, but you can change these colours
to suit your preference. You can also tick the box to Colour volume bars by
price up/down movement.
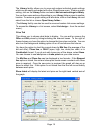
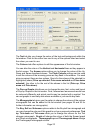
Time Tab
This gives you control over the time scale displayed in the graph window. The
Days viewed drop-down menu allows you to view up to ten days’ intraday prices
at any one time. Please note that you will only be able to view the requested
days if you have downloaded sufficient history (see Intraday Price History on
page 10).
There are two date display options; Today is last day and Display from. You
can choose a specific date by selecting the Display from radio button and
entering a date in the date box beside it.