


Page 16
Page 17
Page 16
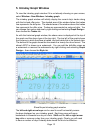
The following three time scale options are available:
Show all data will display all trades over a twenty four hour period, including
trades outside of trading hours.
Market hours will display trading hours only (this will vary depending on the
exchange that the share is listed on).
User defined hours lets you choose the period that you want to see (this can be
useful to eliminate trading spikes caused by opening and closing auctions).
To customise the required time period for each exchange, use the Define button
to the right of the User defined hours radio button. Remember that you can
quickly zoom into a selected time period by clicking the left mouse button,
dragging across the graph and releasing (double click to return to full view).
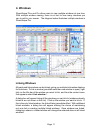
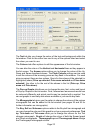
The Fixed period length drop-down menu can be used to set the time periods for
the period based volume, for OHLC bars, candlesticks, analytics and indicators
such as moving averages and RSI. For example, if you select 5 minutes from
the drop-down menu and have already selected period based volume from
the Trades tab (see page 16), the volume histogram will show the cumulative
volume figures for each five minute period rather than for each and every trade
that comes in.
The Start with full period and Start with half period options change the starting
point of each period bar. In the case of sixty minute periods, using Start with
full period would begin each bar at the start of the hour. Using Start with half
period would begin each bar at half past each hour.
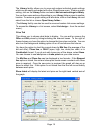
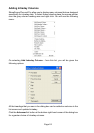
Lines & Text Tab
Allows you to edit all the colours, text and lines in the graph window.
As different stock exchanges operate on different time zones the Time Zone
Label can be used to identify the time zone for a specific share. The label will
display a code for the time zone and then the time difference in relation to
Greenwich Mean Time (GMT).
The Day Separator option allows you to choose how data is displayed for
multiple days. Gap will add a space between days, Frame will draw a line
between days and None will display continuous prices between days viewed.
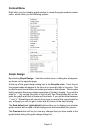
Style Tab
You can edit the background colour and add, remove and style the
watermark.
Watermarks that can be added include Epic Code, Last mid price, Mid price
change, Bid/Offer prices, Volume title, Average trade volume, Analytic title,
Last analytic value.