


Page 26
Page 26
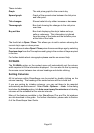
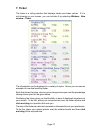
These include:
Graph The mid price graph for the current day.
Spread graph Graph of the spread value between the bid price
and offer price.
Tick changes Shows trade ticks by either increase or decrease.
Thermograph Bar chart showing the changes to the mid price
over time.
Buy sell bar Bar chart displaying the day’s trades as buys,
sells or unknowns. This information is inferred
from the price of the trade and the bid/offer price
at the time of the trade.
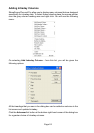
The fourth tab is Open / Close. This allows you to add a column showing the
current day’s open or close prices.
You can choose to show Open / Close prices from several days ago by selecting
Previous days from the Time options and typing in the number of days required
in the box.
For further details about micrographs please see the on-screen Help.
Fit Width
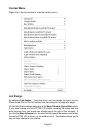
The Fit Width option on the context menu will automatically set the column
width required to fit the information displayed. You can also do this by moving
the mouse cursor between two column headings and double clicking.
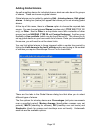
Sorting Columns
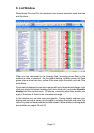
All list columns within ShareScope can be sorted by double clicking on the
column heading. The heading of the sorted column will be in bold text.
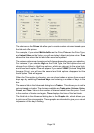
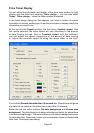
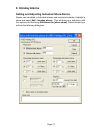
If you are sorting by intraday columns, you can set these to be resorted
automatically as data comes in. Select Tools : Options… : Lists. In the dialog
box below the Intraday option, tick Auto resort every five minutes and intraday
columns will be refreshed at five minute intervals.
Many of the features available in the ShareScope Plus and Pro list windows
are not described in this guide. For further information, please refer to Section
6 of the ShareScope User Guide.