


Page 18
Page 19
Page 18
Lines
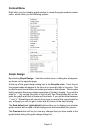
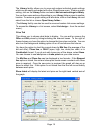
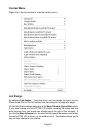
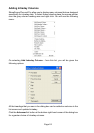
You can add lines to the intraday graph window by selecting Lines & Text from
the context menu, or using Shift and dragging with the left mouse button
just as you can on your historical graph. Using right shift and left click adds
a horizontal line starting from the cursor.
Under the Lines & Text sub menu there is also a choice of line studies available.
These include Fibonacci Arc, Fibonacci Fan, Fibonacci Retracement, Gann
Angles and Speed Resistance Lines.
You can also draw lines on the analytics windows and the volume histogram in
the intraday and historical graph windows.
Line studies and manually added lines can be drawn across more than one
day.
For information on the historical graph window that is not mentioned here, please
see the ShareScope User Guide, Section 4.
Shapes
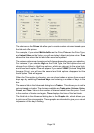
You can add Shapes to intraday graphs to mark or highlight areas of interest.
To add a shape, right click on the graph screen, select Lines and Text and
then Draw a Shape.
Your cursor will then turn into a crosshair. Click on the graph where you want
the shape to start and drag the mouse to position and size your shape.
To edit the shape or its settings right click inside the body of the shape and
select Colour and Style....
To display a shape on more than one graph setting, right click on the shape
and go to Select Display.... You can choose to apply a shape to All Settings,
Current setting only or Selected settings.