


Page 18
Page 18
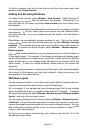
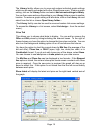
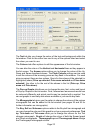
Analytics Tab
The calculation of analytics can be edited on an intraday graph when two or
more day’s history is displayed.
If you select the Use all data radio button, this will use all available data for
each day. This includes price movements outside of normal market hours. If the
Use Graph time radio button has been selected the Analytics will be calculated
using trading hours only. To define your own set period, select the User defined
radio button and specify the required times from the adjacent boxes.
In the lower half of the Analytics tab you can choose to have the analytic
indicators flow between days, if more than one day is displayed. For example,
if you have two days of intraday prices displayed with a moving average, you
may wish to see the moving average calculated continuously across day 1 and
day 2, so that at the start of day 2 the moving average will still be using prices
from the end of day 1. This will affect all the intraday indicators available in
ShareScope Plus and Pro including moving averages, Bollinger bands, RSI
and MACD indicators.
Other options include: Draw a timescale below analytic graphs, No gap
between analytic graphs and Show title on analytic graphs. These options
are also available for historical graphs and are detailed in Section 4 of the
ShareScope User Guide.
The OHLC Data Summary shows the data source and the period length details
that you are using for your indicators. You can edit the source (mid prices or
trade prices) in the Price tab. You can edit the period length in the Time tab.
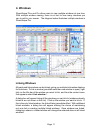
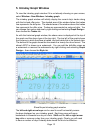
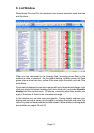
Intraday Analytics
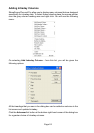
To add analytics to the intraday graph window, right click over the graph and
select Add Indicator or Add Market Graph from the context menu (as shown
on page 14).
Among the many analytics available are ATR (Average True Range), RSI (Welles
Wilder’s Relative Strength Indicator), MACD (Moving Average Convergence
Divergence), ADX (Average Directional Movement) and Stochastic Oscillator
indicators, as well as Advance/Decline Line and STIX market graphs. You
can display up to four indicator windows at a time, with up to four indicators in
each window. They can be maximised and re-sized independently and all are
updated intraday.
The analytics and moving averages are based upon the Fixed period length
set in the Time tab of the graph design dialog box (see page 17). So if you set
a fixed period length of 5 minutes, a 20-period moving average will be based
on the last prices in each of the twenty prior 5-minute periods. The data source
for your indicators can be viewed in the OHLC Data Summary (see above).
For a full list and definition of all the indicators and market graphs available in
ShareScope Plus and Pro please see the on-screen Help menu.