


128
CHAPTER2 Dependence Functions
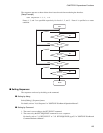
2.3.7 Trace
This section describes the trace function of the emulator debugger (MB2198).
The program execution history can be analyzed in detail using the data recorded by
trace.
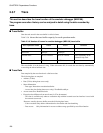
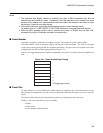
■ Trace Buffer
One data unit stored in the trace buffer is called a frame.
Table 2.3-6
shows the trace buffer capacity for each operation mode.
The trace buffer is in the form of a ring. When it becomes full, it records the next data by automatically
overwriting the oldest buffered data.
■ Trace Data
Data sampled by the trace function is called trace data.
The following data are sampled:
• Address (32 bits)
• Data (32-bit; during data access only)
• Status Information
- Data type: Instruction execution/read/write
- Access data size (during data access only): Word/halfword/byte
• Access status Size: Read/write/code
• Execution time difference from next frame (in 25 ns increments)
- This data is available only when an evaluation chip with the external trace bus interface is used with
the external trace mode.
However, actually, the trace buffer stores the following data items:
- Code execution: Only address information for time before and after branching
- Data access: Only information for access to address range specified by trace filter function
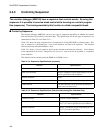
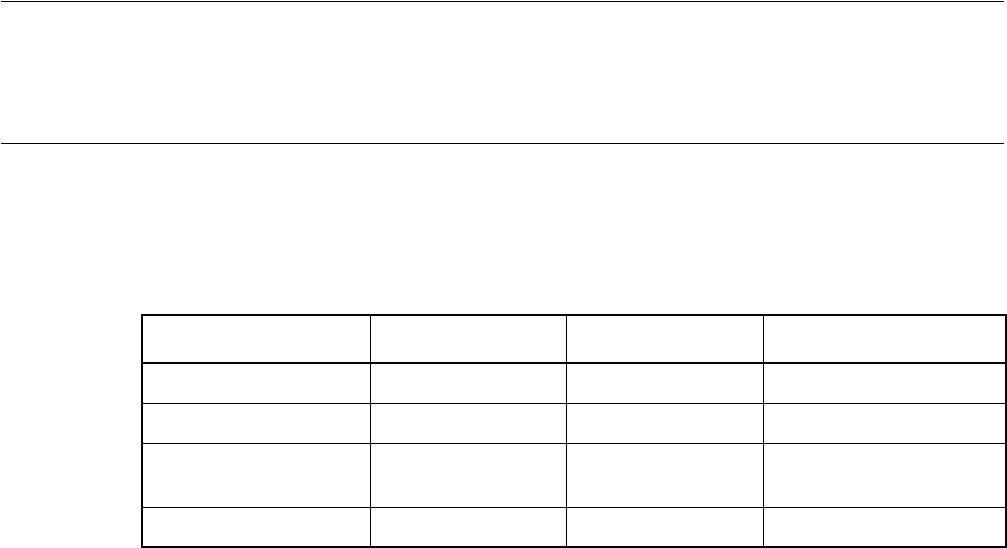
Table 2.3-6 Number of frames in emulator debugger (MB2198) trace buffer
MCU operation mode DSU3 DSU4 Remarks
Full trace 64Kbyte 256Kbyte
Real time 64Kbyte 256Kbyte
Internal trace 64 to 512 frames 64 to 512 frames Varies depending on the
evaluation chip used.
External trace 65536 frames 65536 frames