


112 Operating the Meter
d) The fourth line shows the Run Ref. Number that was
entered by the user at the beginning of the survey, the
Record number and total number of records in the file
and the Date and Start Time when the first data point
was taken.
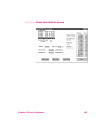
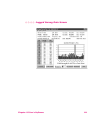
2. The lower section of the window shows the measured data in
both tabular and graphical form.
a) The table on the left side of the screen displays up to
eighteen (18) data points at one time. The Data Point
# number will be a continuous sequence shown
sequentially in the time the data points were taken.
The Field Strength is shown in the unit-of-measure
used during the survey. Mode 2 data (a series of
spatially averaged data points) shows both the
Average and Max. (or peak) value for every data point.
Mode 3 data (continuous logging mode) shows the
Time that each data point was taken
b) The bar graph on the right side of the screen shows
the same data listed in the table. The title of the bar
graph is Logged Data for Mode 1 data, Spatial
Average & Max. for Mode 2 data, and Continuous
Log for Mode 3 data.
c) The range of the vertical axis of the graph is
automatically adjusted to accommodate the data. The
number of data points will also vary depending on the
data with a maximum of thirty (30) displayed at one
time.
d) The Scroll Back and Scroll Forward buttons are used
when there are more than sixteen data points to view.
Each time you click on one of these buttons you
advance or go back by sixteen data points.
e) The New Record and Old Record buttons allow you
to go back and forth between different records within
the same file. Each survey is a different record
identified by the Run Ref. Number that was entered by
the user at the beginning of the survey.
If you used the
PAUSE feature dur-
ing continuous log
-
ging, the time shown
for each data point
will be incorrect for
all data points after
the pause feature
was used.
Note